Modalità di lettura

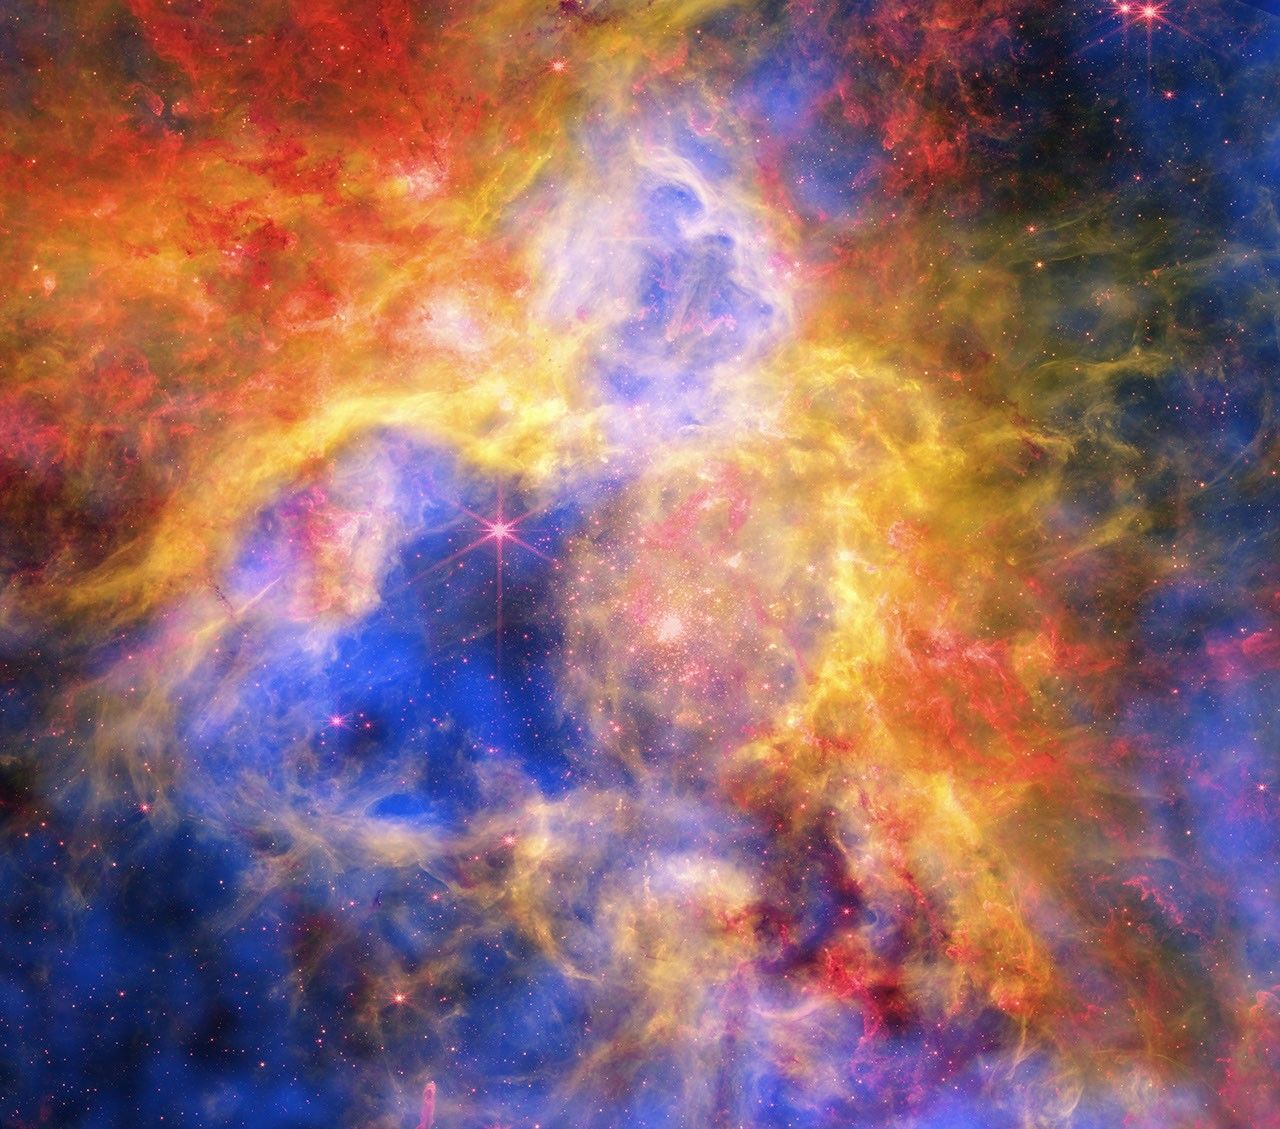
Colorful Collage of Tarantula Nebula

Like a collage made of layered sheets of colored cellophane, a vibrant new image layers observations of a famous star-forming nebula from NASA space telescopes. The resulting cosmic “craft” reveals new details about the star formation region known as 30 Doradus, or the Tarantula Nebula.

  •  

Colorful Collage of Tarantula Nebula

This multiwavelength image of the Tarantula Nebula, one of the brightest and largest regions of star formation to Earth, shows X-rays from Chandra that reveal gas that has been blown away in winds from the surfaces of young, massive stars and heated to millions of degrees by shock waves, like sonic booms from supersonic jets. The infrared data from Webb shows thousands of young stars, plus swaths of cool dust that will provide the ingredients to one day form new stars and planets. Hubble optical data uncovers hydrogen gas that is warmer than seen with Webb, as well as some individual stars through the nebula.
X-ray: NASA/CXC/Ohio State Univ./J. Rodriguez et al; Infrared: NASA/ESA/CSA/STScI; Optical: NASA/ESA/STScI; Image Processing: NASA/CXC/SAO/P. Edmonds

Data from NASA’s Chandra X-ray Observatory, NASA’s James Webb Space Telescope, and NASA’s Hubble Space Telescope combine to reveal a vibrant view of 30 Doradus, or the Tarantula Nebula, in this Aug. 11, 2026, image. Located in the Large Magellanic Cloud, a small neighbor galaxy to the Milky Way about 160,000 light-years from Earth, the Tarantula has thousands of young stars embedded in a vibrant honeycomb-like structure of gas and dust.

By studying the data from Chandra, Hubble, and Webb, combined with data from the agency’s retired Spitzer Space Telescope, astronomers determined that the Tarantula may be losing energy from several sources, including hot gas escaping from the nebula.

Learn more about this image.

Image credit: X-ray: NASA/CXC/Ohio State Univ./J. Rodriguez et al; Infrared: NASA/ESA/CSA/STScI; Optical: NASA/ESA/STScI; Image Processing: NASA/CXC/SAO/P. Edmonds

  •  

Hubble Solves Merger Mystery From Milky Way’s Early Years

5 min read

Hubble Solves Merger Mystery From Milky Way’s Early Years

An illustration of two galaxies in the midst of a collision against a dark, star-filled background.  The collision takes up the middle third of the illustration. On the right, a larger galaxy is viewed at an angle from 11 ou2019clock to 4 ou2019clock, with a white-yellow core surrounded by mottled brown dust lanes and faint bluish spiral arms. To the left, a smaller, bright blue-white galaxy is stretched into a curved, hook-like shape as gravity distorts it. A broad, glowing bridge of pale blue gas and stars extends off the galaxy at the left, while wispy streams extend above and below the larger galaxy at the right. The words u201cArtistu2019s Conceptu201d appear in the lower left corner.
About 12 billion years ago, a dwarf galaxy known as LKH collided with a young Milky Way and merged with it. This artist’s concept portrays that collision. NASA’s Hubble Space Telescope uncovered definitive evidence of this collision by studying globular star clusters.
Illustration: NASA, ESA, Joseph Olmsted (STScI)

Our home galaxy, the Milky Way, grew to its current size in part by consuming smaller galaxies. Now, new data from NASA’s Hubble Space Telescope shows definitive evidence of a dwarf galaxy merging with the young Milky Way galaxy in the earliest phases of its evolution. This finding extends our knowledge of our galaxy’s history 1.8 billion years farther back in time than before.

The results published Monday in the journal Nature Astronomy.

The Milky Way today is a massive spiral galaxy home to hundreds of billions of stars. However, our galaxy wasn’t always so large; it has grown by forming new stars from its gas clouds as well as collecting stars, gas, and dark matter from other galaxies through mergers.

The most recent massive merger in our galaxy’s history took place with the Sagittarius dwarf galaxy, beginning over 6 billion years ago and still ongoing today. Looking back into the even more distant past, researchers learned that the Milky Way galaxy consumed another dwarf galaxy called Gaia-Sausage-Enceladus 10 billion years ago. This ancient merger greatly affected the structure of our galaxy’s disk of stars. Other, smaller mergers occurred between these two.

But our galaxy’s history doesn’t stop there. Both observations and simulations have suggested that another large merger preceded these two, though the specifics of the event have been heavily debated. Now, Hubble has uncovered definitive evidence of an earlier merger that occurred about 11.8 billion years ago, or just 2 billion years after the big bang.

“Our home is the Milky Way galaxy, but we do not know how our house was built,” said Davide Massari, lead author, Astrophysics and Space Science Observatory of Bologna in Italy. “In this paper we discover where the first significant batch of bricks came from: a dwarf galaxy that we call LKH.”

Cosmic archaeological sites

Immense astronomical surveys and precision data from spacecraft like ESA’s (European Space Agency’s) Gaia mission have been instrumental in piecing together the history of our galaxy. The farther back into our galaxy’s history that scientists attempt to look, the more difficult it becomes to tell what happened. When our galaxy was young, it was smaller and much closer in size to the galaxies it clashed with. It was also more chaotic, and it’s possible that the signs of mergers have been erased over billions of years.

It’s into this murky past that Hubble peered. Researchers used Hubble to study some of the Milky Way galaxy’s globular clusters: immense, roughly spherical collections of tens of thousands to a few million stars. Globular clusters contain some of the oldest stars in our galaxy, and they can act as cosmic archaeological sites that preserve stars from other galaxies the Milky Way galaxy has collected.

“Thanks to the high resolution and depth of Hubble imaging, we could measure the age and the metal content of these clusters with unprecedented precision,” said Chiara Zerbinati, study co-author, University of Bologna in Italy. “Coupled with measurements from Gaia, this made it possible to distinguish a population of globular clusters that are different from the others. These are the clusters that were born in LKH, and they tell us when that galaxy was devoured by ours, and how massive it was.”

The team analyzed Hubble observations of 39 globular clusters in the inner 20,000 light-years of our galaxy, where evidence of the most ancient mergers should be preserved. They expected this sample to contain globular clusters that formed within the young Milky Way galaxy as well as those collected from the Gaia-Sausage-Enceladus dwarf galaxy about 10 billion years ago.

Using Hubble’s sensitive observations to determine each cluster’s precise age and associated metallicity — the abundance of elements heavier than helium — they determined there was a third population of globular clusters in the inner regions of our galaxy. The team found that these clusters are older than the group collected in the Gaia-Sausage-Enceladus merger, but younger than those born in the Milky Way, regardless of their metal content. These  clusters, therefore, came from a separate and even earlier merger — in which the Milky Way galaxy absorbed a dwarf galaxy containing roughly 500 million times the mass of the Sun in stars, a significant fraction of our galaxy’s mass at the time. They named this dwarf galaxy Low-energy-Kraken-Heracles, or LKH, in honor of three earlier research papers that championed the idea of a merger early in our galaxy’s history.

Such a large merger so early in the Milky Way galaxy’s formation has profound implications for the evolution of our galaxy.

“Some past studies have argued that the earliest phases of our galaxy’s evolution were defined by stars born only in our galaxy,” says Massari. “Here, we have shown that stars born in external galaxies also need to be considered.”

The team plans to continue their work to unravel the history of the Milky Way galaxy by studying its globular clusters, aiming to characterize all the massive mergers that our galaxy has experienced across cosmic history.

“Hubble is observing globular clusters that have never been studied before, and this will help us characterize the merger events that are far back in time in the Milky Way galaxy’s history,” said Fernando Aguado-Agelet, co-author, University of Vigo and the University of La Laguna in Spain.

The Hubble Space Telescope has been operating for more than three decades and continues to make ground-breaking discoveries that shape our fundamental understanding of the universe. Hubble is a project of international cooperation between NASA and ESA (European Space Agency). NASA’s Goddard Space Flight Center in Greenbelt, Maryland, manages the telescope and mission operations. Lockheed Martin Space also supports mission operations at Goddard. The Space Telescope Science Institute in Baltimore, which is operated by the Association of Universities for Research in Astronomy, conducts Hubble science operations for NASA.

Related Images & Videos

An illustration of two galaxies in the midst of a collision against a dark, star-filled background.  The collision takes up the middle third of the illustration. On the right, a larger galaxy is viewed at an angle from 11 ou2019clock to 4 ou2019clock, with a white-yellow core surrounded by mottled brown dust lanes and faint bluish spiral arms. To the left, a smaller, bright blue-white galaxy is stretched into a curved, hook-like shape as gravity distorts it. A broad, glowing bridge of pale blue gas and stars extends off the galaxy at the left, while wispy streams extend above and below the larger galaxy at the right. The words u201cArtistu2019s Conceptu201d appear in the lower left corner.

LKH Milky Way Merger Illustration

About 12 billion years ago, a dwarf galaxy known as LKH collided with a young Milky Way and merged with it. This artist’s concept portrays that collision. NASA’s Hubble Space Telescope uncovered definitive evidence of this collision by studying globular star clusters.


Share

Details

Last Updated
Aug 17, 2026
Editor
Andrea Gianopoulos
Contact
Media

Claire Andreoli
NASA’s Goddard Space Flight Center
Greenbelt, Maryland
claire.andreoli@nasa.gov

Bethany Downer
ESA/Hubble
Baltimore, US

Christine Pulliam
Space Telescope Science Institute
Baltimore, Maryland

  •  

NASA Challenge Tests Wheel Designs for Moon Base Mobility

5 Min Read

NASA Challenge Tests Wheel Designs for Moon Base Mobility

NASA engineers, NASA Robotics Academy students, and teams from the Rock and Roll with NASA Challenge pose with the wheel prototypes at NASA’s Johnson Space Center Rock Yard in Houston on July 31, 2026.
Credits: NASA/Luna Posadas Nava
NASA engineers, NASA Robotics Academy students, and teams from the Rock and Roll with NASA Challenge pose with the wheel prototypes at NASA’s Johnson Space Center Rock Yard in Houston on July 31, 2026.
NASA/Luna Posadas Nava

As NASA prepares to establish the Moon Base, advancing surface mobility will be key to helping crews and robotic systems travel farther across the lunar surface. 

To help advance that capability, the Rock and Roll with NASA Challenge invited public innovators to design and build next-generation lunar rover wheels. 

Five teams from 128 submissions and 49 countries advanced to the final phase of the competition, where they tested their prototypes on July 31 at NASA’s Johnson Space Center in Houston. 

The Huff Helo lunar wheel prototype is tested at Johnson Space Center’s Rock Yard.
NASA/Luna Posadas Nava

The challenge sought lightweight, durable, and scalable wheels that could support longer-duration lunar surface operations. The designs also needed to be compliant enough to absorb impacts, maintain traction at higher speeds, and withstand the harsh lunar environment. 

“Every additional kilometer a rover can reliably travel will expand how far we can explore, what science we can achieve, and what infrastructure we can build,” said Ed Herrera, robotics engineer at Johnson and co-leader of the challenge project. 

NASA Johnson uses ground prototypes to test mobility technologies, while lunar terrain vehicles will be delivered to the lunar surface through the Commercial Lunar Payload Services initiative. For the challenge, the wheels were fitted to MicroChariot, a 45-kilogram test rover, and put through a series of courses at Johnson’s Rock Yard to evaluate their performance across different types of terrain. 

NASA Robotics Academy students navigate the lunar wheel prototype Scotch Pad Tyres fitted on the MicroChariot rover at Johnson’s Rock Yard.
NASA/Luna Posadas Nava

“Crowdsourcing gives us an opportunity to look beyond traditional approaches for lunar wheel design,” Herrera said. “The more wheel technologies we can develop and understand, the more options we have to meet the needs of different vehicles, terrains, and missions on the Moon and Mars.” 

Those ideas were reflected in five distinctly different designs. 

The HTR Variable Flex Lunar Wheel created by Hellenic Technology of Robotics SA uses an internal system designed to vary the wheel’s stiffness depending on terrain and vehicle needs. The team adapted technology it had been developing for terrestrial wheels for about a decade. 

The Hiper Wheel created by Hyperbola uses tensioned cables and a corigated structure that provides spring-like behavior, allowing the wheel to flex without relying on traditional radial spokes. 

The Huff Helo Flexible Titanium Wheel created by Huff Helo Inc. uses formed titanium sheet metal as both structure and spring. During testing, the team found that the strength of the design also made the wheel more rigid, causing it to bounce over some obstacles rather than conform to the terrain. 

The Payne Aviation Wheel created by Deborah and Craige Payne took inspiration from aviation and history. Its designer, an aircraft mechanic, combined a pneumatic approach with ideas from early automobile tire designs. 

The winning Scotch Pad Tyres team poses with their prototype and MicroChariot at Johnson’s Rock Yard.
NASA/Luna Posadas Nava

The winning Scotch Pad Tyres concept came from an Australian mechanical engineer Daniel Bloomfield and his son Isaac Bloomfield. Their prototype uses a Nomex-based tire structure supported around an aluminum hub. The soft material allows the tire to deform around terrain, while internal support helps it maintain its shape. A treated outer surface of epoxy and corundum grit was integrated to improve traction. 

The Rock Yard testing also demonstrated why different terrains may require different approaches. Loose material can affect traction, while rocks and slopes place different demands on wheels such as vehicle stability. 

The HTR Variable Flex Lunar Wheel prototype sits alongside NASA’s Space Exploration Vehicle at Johnson’s Rock Yard.
NASA/Luna Posadas Nava

As lunar exploration expands, different vehicles will require different combinations of speed, load capacity, durability, and terrain performance. 

Seeking that variety was part of the challenge design. The design options gave engineers different technologies to consider and potentially advance. 

“This challenge brought in new ideas from outside traditional industries and helped us identify wheel technologies that may be suitable for longer-duration surface operations,” said Lucien Junkin, robotics engineer at Johnson and co-leader of the challenge project. 

The next phase could evaluate how the wheels respond to lunar-like dust, vacuum, and extreme temperatures in Johnson’s thermal vacuum chambers. Engineers could also assess the designs over longer distances and at different sizes and loads. 

“Mobility is key to everything we want to do on the Moon,” Junkin said. “The farther we want to explore, the more we need to advance the wheel technologies that can get us there.” 

The Common Robotics Project of the Robotic Systems Technology Branch within Johnson’s Engineering Directorate conducted the Rock and Roll with NASA Challenge. NASA’s Center of Excellence for Collaborative Innovation, part of the Prizes, Challenges, and Crowdsourcing Program within the Research and Technology Mission Directorate, managed the challenge contract. Students in NASA’s Robotics Academy helped prepare hardware and support the competition, while engineers from NASA’s Glenn Research Center in Cleveland supported reviews of concepts and proposals. HeroX administered the challenge on behalf of NASA.  

About the Author

Sumer Loggins

Sumer Loggins

Keep Exploring

Discover More Topics From NASA

  •  

Antiche vestigia nel cuore della Via Lattea

La Via Lattea è la galassia che ospita, tra le sue centinaia di miliardi di stelle, anche il Sole e il Sistema solare: è la nostra casa nel cosmo, eppure finora non sapevamo come fosse stata costruita. Un nuovo studio condotto dall’Istituto nazionale di astrofisica (Inaf) nell’ambito del progetto Carma (Cluster Ages to Reconstruct the Milky Way Assembly), pubblicato oggi su Nature Astronomy, aggiunge un tassello alla risposta, individuando uno dei suoi primi “mattoni” fondanti: una fusione con una galassia esterna avvenuta all’incirca due miliardi di anni dopo il Big Bang, in un’epoca finora avvolta nell’incertezza.

Ngc 6397 visto da Euclid. Si tratta del secondo ammasso globulare più vicino alla Terra, situato a circa 7.800 anni luce. Formato da centinaia di migliaia di stelle legate dalla gravità, è uno degli oggetti più antichi della Via Lattea e conserva preziose informazioni sulla storia della nostra Galassia. Osservare tutte le stelle di un ammasso globulare non è semplice: nel suo centro, le più luminose nascondono le più deboli, mentre nelle regioni esterne si trovano stelle meno massicce che custodiscono le tracce delle antiche interazioni con la Via Lattea. Crediti: Esa/Euclid/Euclid Consortium/Nasa, image processing by J.-C. Cuillandre (Cea Paris-Saclay), G. Anselmi

Fino a oggi, la storia di formazione della Via Lattea, fatta di fusioni tra galassie più e meno grandi, era stata ricostruita con sicurezza solo fino a circa dieci miliardi di anni fa, l’epoca dell’incontro con Gaia-Enceladus, una galassia nana che si scontrò con la nostra e fu successivamente inglobata. Cosa fosse accaduto nelle primissime fasi di vita della nostra galassia restava invece ignoto: non era chiaro se un evento di fusione con una galassia esterna avesse avuto luogo, o se l’evoluzione avesse riguardato esclusivamente stelle nate “in casa”.

Davide Massari, ricercatore dell’Inaf di Bologna. Crediti: Inaf

«Siamo partiti dall’ambizione di ricostruire la storia di assemblaggio della Via Lattea, cioè tutti gli eventi di fusione galattica che l’hanno portata al suo aspetto attuale», spiega Davide Massari, ricercatore dell’Inaf e primo autore dell’articolo scientifico. «Come traccianti abbiamo usato gli ammassi globulari: soprattutto nelle zone interne della galassia, dove l’estinzione è altissima, sono gli unici oggetti per cui possiamo ottenere misure eccellenti sia del movimento orbitale sia dell’età».

Il punto di svolta è stato lo sviluppo di un metodo, basato sui dati del telescopio spaziale Hubble, in grado di misurare l’età degli ammassi globulari con una precisione mai raggiunta prima. Con stime così precise, il team ha scoperto che la popolazione di ammassi globulari nelle zone più interne della Via Lattea si dispone lungo tre distinte sequenze in base all’età e alla metallicità: una legata alla fusione con Gaia-Enceladus, una alla Via Lattea originaria e una terza, intermedia, spiegabile soltanto con l’esistenza di almeno una fusione precedente e finora ignota. «L’analisi statistica indica proprio nello scenario a tre progenitori quello di gran lunga più probabile», commenta Cristiano Fanelli dell’Inaf, co-autore dello studio.

La galassia responsabile di quella terza sequenza aveva una massa stellare paragonabile a quella di Gaia-Enceladus, pari a circa mezzo miliardo di masse solari, e aveva depositato gran parte del suo materiale entro poco meno di 20mila anni luce dal centro della Via Lattea.

«Questo lavoro ci dice cos’è successo alla Via Lattea nella sua infanzia. Porta infatti alla luce un evento particolarmente rilevante che ha influenzato l’intera evoluzione successiva della galassia. Se una delle grandi domande dell’umanità è ‘da dove veniamo?’, noi offriamo almeno un tassello della risposta», aggiunge Chiara Zerbinati, dottoranda presso il Dipartimento di fisica e astronomia dell’Università degli Studi di Bologna, che ha lavorato al progetto già durante la tesi magistrale.

Circa 12 miliardi di anni fa, una galassia nana nota come Lkh si scontrò con la giovane Via Lattea e si fuse con essa. Questa rappresentazione artistica raffigura quella collisione, avvenuta nell’arco di milioni di anni. Studiando gli ammassi globulari, il telescopio spaziale Hubble della Nasa ha trovato prove definitive di questo antico scontro. Crediti: Nasa, Esa, Joseph Olmsted (Stsci)

«Il percorso verso la pubblicazione è stato lungo e articolato, tanto che il nome dell’evento di fusione è cambiato più volte», conclude Massari. «Quello definitivo, Low-energy-Kraken-Heracles (Lkh), è un acronimo che rende omaggio ai tre lavori che, per primi, avevano ipotizzato l’esistenza di questo antico incontro galattico».

Per saperne di più:


  •  

Chasing Fire Clouds in Utah


Natural Color
Brightness Temperature

Textured gray wildfire smoke streams east from a fire burning near Fishlake National Forest. A dark shadow is visible to the east of a tall plume near the fire front.
NASA Earth Observatory/Michala Garrison

A data visualization shows the cloud-top brightness temperature of the same scene. Tall, cold smoky clouds appear white, and warmer plumes at lower heights appear purple.
NASA Earth Observatory/Michala Garrison

Textured gray wildfire smoke streams east from a fire burning near Fishlake National Forest. A dark shadow is visible to the east of a tall plume near the fire front.
NASA Earth Observatory/Michala Garrison
A data visualization shows the cloud-top brightness temperature of the same scene. Tall, cold smoky clouds appear white, and warmer plumes at lower heights appear purple.
NASA Earth Observatory/Michala Garrison

Natural Color

Brightness Temperature


A smoke-infused pyrocumulonimbus (pyroCb) rises from the Widemouth 2 fire in Utah in these images captured by the MODIS (Moderate Resolution Imaging Spectroradiometer) on NASA’s Aqua satellite. The left image is natural color; the right image is false color, revealing cloud-top brightness temperatures below -40°C, a commonly used threshold for identifying pyroCbs. NASA Earth Observatory images by Michala Garrison.

Scientists have long known that volcanoes can launch large quantities of particles into the stratosphere. In the past few decades, it has become clear that wildfires do this, too, by generating towering, smoke-infused pyrocumulonimbus (pyroCb) clouds.

The largest pyroCbs are stunning weather-making features that generate massive thunderheads capable of unleashing lightning, hail, and heavy rain. A growing body of research shows that pyroCbs can also leave an outsized imprint on the upper atmosphere by channeling pulses of particles and gases into the stratosphere’s mostly dry, cloudless confines. Once there, smoke can spread widely and linger for months or years, sometimes circling the globe and likely influencing the ozone layer and Earth’s energy budget.

Understanding these enigmatic and dangerous clouds is why a team of atmospheric scientists—part of a NASA mission called INSPYRE (INjected Smoke and PYRocumulonimbus Experiment)—is spending the summer chasing them with NASA’s ER-2 aircraft, NSF/NCAR’s GV, and a suite of truck-based sensors. The team completed one of its first sampling runs of the summer on August 3, 2026, when the GV flew through a high-altitude pulse of smoke from the Widemouth 2 fire, one of Utah’s largest so far this year.

Lightning ignited the fire on July 27, 2026, but it remained relatively small until August 2, when it more than doubled in size amid intense winds and hot, dry conditions. That afternoon, soon after it had produced two pyroCb bursts, the MODIS (Moderate Resolution Imaging Spectroradiometer) on NASA’s Aqua satellite captured this image (above), showing a chimney of high-altitude cloud and smoke casting a shadow on low-altitude smoke below.

These bursts propelled clouds high enough that Aqua measured cloud-top brightness temperatures well below −40°C, a common threshold for identifying pyroCbs and a sign that the cloud tops were bubbling to the top of the troposphere and sometimes into the stratosphere. The brightness temperature measurements “reveal two discrete pulses of pyroCb action,” said Michael Fromm, a scientist at the U.S. Naval Research Laboratory. “The westernmost is the youngest pulse and stands out in the visible imagery by virtue of its shadow.”

Though relatively routine and minor, this pyroCb event followed a pre-dawn pyroCb from the same fire, imaged by the NOAA weather satellite GOES-West. “Morning pyroCbs are much more unusual,” Fromm said, because they don’t benefit from daytime heating that helps fuel convection. In this case, however, there appeared to be enough atmospheric instability and water vapor in the air to allow for pyroCb development. 

Multiple pyroCbs in a single day could have added unwanted complexity for forecasters and fire officials battling the blaze and organizing evacuations, said David Peterson, INSPYRE’s principal investigator. “Minimizing that sort of uncertainty for fire forecasters is a big part of the reason we’re out here studying this,” he added.

Remote sensing experts like Peterson and Fromm routinely study pyroCbs from afar with satellites, but it’s less common for pilots to chase and sample smoke plumes just hours after they form. In this case, the GV aircraft, on the ground in Colorado when the Widemouth 2 fire blew up, made a beeline for a high-altitude smoke plume as it drifted over New Mexico on August 3. The instruments on the plane sampled smoke at roughly 12 kilometers (8 miles) above the surface, collecting data at a height that isn’t typically incorporated into forecast models.

An aerial image shows a thick, puffy white cloud rising high above a patch of darker smoke visible near a surface of variable mountainous terrain.
A photo of the Widemouth 2 fire taken from an INSPYRE aircraft during a sampling flight on August 3, 2026, shows a smoke-infused cloud rising high above the fire.
Bernadett Weinzierl/University of Vienna

During that mission, a scientist on board captured this image (above) of a pyrocumulus (pyroCu) billowing up over the Widemouth 2 fire. While not as tall or energetic as pyroCbs, pyroCus are precursor clouds that share many of the same characteristics. Here, heat from the fire is fueling strong convective updrafts, forming a towering cloud with puffy overshooting tops that poke into the upper troposphere as lower-altitude smoke drifts below.

Satellites excel at identifying pyroCbs by measuring the temperature of the cloud tops that form above smoke plumes. Using this technique, researchers have established that wildfires produce about 70 pyroCbs per year, many in dense forests of Canada and Russia, though plenty also occur in grasslands and savannas in the United States and Australia. So far in 2026, Fromm and colleagues have identified at least 13 in the continental United States.

Since one of the first pyroCbs appeared in the scientific literature in the early 2000s, scientists have cataloged well over 700 events, and they now believe that wildfires may contribute up to 25 percent of the black carbon and organic aerosols in the lower stratosphere. The sheer frequency of pyroCbs means that the total mass of particles they inject over the course of a wildfire season may rival that of large volcanic eruptions.

Still, many questions about the enigmatic clouds remain unanswered. It isn’t clear what vegetation is most likely to fuel pyroCbs, why some form more lightning than others, why they form in only a small fraction of fires, and how to accurately forecast them.

“Whether it be their dangerous manifestations on the ground or their long-lasting imprint on the upper troposphere and lower stratosphere,” Fromm said, “pyroCbs continue to surprise us.”

NASA Earth Observatory images by Michala Garrison, using MODIS data from NASA EOSDIS LANCE and GIBS/WorldviewPhoto by Bernadett Weinzierl/University of Vienna. Story by Adam Voiland.

Downloads

Textured gray wildfire smoke streams east from a fire burning near Fishlake National Forest. A dark shadow is visible to the east of a tall plume near the fire front.

August 2, 2026: Natural Color

JPEG (1.63 MB)

A data visualization shows the cloud-top brightness temperature of the same scene. Tall, cold smoky clouds appear white, and warmer plumes at lower heights appear purple.

August 2, 2026: Brightness Temperature

JPEG (1.07 MB)

An aerial image shows a thick, puffy white cloud rising high above a patch of darker smoke visible near a surface of variable mountainous terrain.

August 3, 2026

JPEG (319.28 KB)

References & Resources

You may also be interested in:

Stay up-to-date with the latest content from NASA as we explore the universe and discover more about our home planet.

Cottonwood Fire Chars Utah

5 min read

The blaze burned more than 150 square miles and swept through parts of a ski resort.

Article

Ontario Wildfire Smoke Moves East

3 min read

Canadian wildfires sent plumes of smoke streaming over Ontario, Quebec, and parts of the U.S. Midwest and Northeast.

Article

Cascade Volcanoes Shrouded in Smoke

3 min read

From the International Space Station, astronauts photographed Mount Hood and Mount Rainier as wildfire smoke spread across the Pacific Northwest…

Article
  •  

Summer Triangle Corner: Deneb

3 min read

Summer Triangle Corner: Deneb

Artist's concept of the night sky showing the cygnus constellation, with a dotted line box surrounding the location of the cygnus loop
This image shows an illustration of the constellation Cygnus, Latin for “swan,” in the night sky. The Cygnus Loop supernova remnant, also known as the Veil Nebula, is located near one of the swan’s wings, outlined here in a rectangular box.
NASA

Bird constellations abound in the night sky, including Cygnus, the majestic swan. Easy to find with its dazzling stars, it is one of the few constellations that look like its namesake, and it is full of treasures. Visible in the Northern Hemisphere all summer long, there’s so much to see and even some things that can’t be seen. To locate Cygnus, start with the brightest star, Deneb, also the northeasternmost and dimmest star of the Summer Triangle. The Summer Triangle is made up of three bright stars from three different constellations – read more about it in the September 2022 issue of Night Sky Notes. “Deneb” is an Arabic word meaning the tail. Then travel into the triangle until you see the star Albireo, sometimes called the “beak star” in the center of the summer triangle. Stretching out perpendicular from this line are two stars that mark the crossbar, or the wings, and there are also faint stars that extend the swan’s wings.
 
From light-polluted skies, you may only see the brightest stars, sometimes called the Northern Cross. In a darker sky, the line of stars marking the neck of the swan travels along the band of the Milky Way. A pair of binoculars will resolve many stars along that path, including a sparkling open cluster of stars designated Messier 29, found just south of the swan’s torso star. This grouping of young stars may appear reddish due to nearby excited gas.
 
Let’s go deeper. While the bright beak star Albireo is easy to pick out, a telescope will let its true beauty shine! Like a jewel box in the sky, magnification shows a beautiful visual double star, with a vivid gold star and a brilliant blue star in the same field of view. There’s another marvel to be seen with a telescope or strong binoculars – the Cygnus Loop. Sometimes known as the Veil Nebula, you can find this supernova remnant (the gassy leftovers blown off of a large dying star) directly above the final two stars of the swan’s eastern wing. It will look like a faint ring of illuminated gas about three degrees across (six times the diameter of the Moon).

Illustration showing yellow, brown, orange, and red rapidly spinning disk with jets above and below it. Material is being drawn from an object on event horizon of the black hole.
The black hole named Cygnus X-1 formed when a large star caved in. This black hole pulls matter from the blue star beside it.
Image: NASA, CXC, Melissa Weiss (CXC)

Speaking of long-dead stars, astronomers have detected a high-energy X-ray source in Cygnus that we can’t see with our eyes or backyard telescopes, but that is detectable by NASA’s Chandra X-ray Observatory. Discovered in 1971 during a rocket flight, Cygnus X-1 is the first X-ray source to be widely accepted as a black hole. This black hole is the final stage of a giant star’s life, with a mass of about 20 Suns. Cygnus X-1 is spinning at a phenomenal rate – more than 800 times a second – while devouring a nearby star. Astronomically speaking, this black hole is in our neighborhood, 6,070 light years away. But it poses no threat to us, just offers a new way to study the universe.
 
Check out the beautiful bird in your sky this evening, and you will be delighted to add Cygnus to your go-to summer viewing list and visit NASA’s Black Hole Basics page to learn more!

Originally posted by Dave Prosper: May 2023
Last Updated by Kat Troche: July 2026

  •  

Orbitali elettronici in 3D

Gli elettroni che compongono un atomo non occupano una posizione ben definita: sono descritti da una funzione d’onda, cioè da una mappa di probabilità che descrive dove è più probabile trovarli e come si muovono. Negli orbitali molecolari – l’unione delle funzioni d’onda degli elettroni di una molecola – questa informazione è cruciale: descrive come una molecola assorbe luce, interagisce con l’ambiente e prende parte alle reazioni chimiche.

Un team di ricercatori guidato dall’Università di Gottinga (Germania) ha ricostruito per la prima volta la funzione d’onda di una molecola organica nanometrica in tre dimensioni. Lo studio, al quale hanno preso parte anche Fabio Frassetto e Luca Poletto del Cnr-Ifn (l’Istituto di fotonica e nanotecnologie del Cnr di Padova) e pubblicato lo scorso giugno su Nature Communications, è stato realizzato attraverso la tecnica della tomografia orbitale da fotoemissione: quando la luce colpisce la molecola in esame, questa emette elettroni e, misurandone la quantità di moto, i ricercatori hanno ricavato informazioni su una parte della funzione d’onda, mentre la parte mancante è stata ricostruita attraverso algoritmi matematici.

Gli autori dello studio hanno utilizzato una tecnica di spettroscopia fotoelettronica all’avanguardia, avvalendosi di una sorgente di raggi X morbidi (a sinistra) in grado di fornire impulsi luminosi ultrabrevi, combinata con potenti algoritmi matematici, per rappresentare graficamente la funzione d’onda degli orbitali elettronici (a destra). Crediti: Lukas Kroll

L’idea alla base non è nuova: una prima dimostrazione sperimentale della ricostruzione di orbitali molecolari risale al 2009, e negli anni successivi la tecnica è stata estesa al 3D, ma con un costo sperimentale molto elevato, spesso legato all’uso di sincrotroni di grandi dimensioni. «Abbiamo introdotto due nuovi concetti di grande efficacia. Innanzitutto, riprogettando da zero l’algoritmo informatico, è ora possibile ottenere immagini 3D affidabili con una quantità molto minore di dati sperimentali. In secondo luogo, l’esperimento si basa su una potente sorgente di raggi X morbidi che fornisce impulsi luminosi ultrabrevi», spiega uno dei coautori, Matthijs Jansen, dell’Università di Gottinga. «È proprio la combinazione di queste due tecniche a determinarne il notevole impatto».

L’immagine pubblicata non è una fotografia nel senso classico del termine, come quelle scattate con una fotocamera, ma una visualizzazione che mostra in modo probabilistico dove l’elettrone può trovarsi, ricostruita combinando misure sperimentali e algoritmi matematici. È più simile a una “radiografia matematica” che a uno scatto fotografico tradizionale, dal momento che non è possibile vedere in maniera diretta gli elettroni. In altre parole, la mappa tridimensionale della funzione d’onda ottenuta tramite i dati raccolti e l’algoritmo di ricostruzione assomiglia a una foto in 3D, ma è in realtà un’immagine calcolata che condensa in forma visiva le informazioni quantistiche accessibili solo in modo indiretto.

a) I dati grezzi delle misurazioni, visualizzati come una nuvola di “voxel” (pixel 3D) semitrasparenti disposti su gusci emisferici. Le sezioni trasversali mostrano come solo una frazione dei pixel nello spazio di quantità di moto contenga dati di misura, mentre la maggior parte dei pixel sia priva di dati; b) e c) Immagini tridimensionali della funzione d’onda, che mostrano l’orbitale molecolare occupato più alto di una molecola di Ptcda, sostanza spesso utilizzata per la produzione di coloranti grazie alla sua forte interazione con la luce. Ognuna delle due immagini mostra sia la rappresentazione tridimensionale che le sezioni trasversali dell’orbitale a 1 Å (un decimiliardesimo di metro) di distanza dal centro della molecola. Crediti: Bennecke et al., 2026, Nature Communications

«Questa tecnica potrebbe far diventare realtà la videografia stroboscopica», conclude la prima autrice dello studio, Wiebke Bennecke, dell’Università di Gottinga, «consentendoci non solo di osservare la forma delle funzioni d’onda, ma anche di vedere come essa cambi con una risoluzione ultraveloce, persino dell’ordine dei femtosecondi, ovvero un milionesimo di miliardesimo di secondo. Ciò permetterà di comprendere come una molecola si adatti a variazioni ottiche, elettroniche o chimiche e di trovare nuovi modi per controllare queste interazioni a livello di pochi atomi».

Per saperne di più: 


  •  

APOD: 2026 August 17 – A Golden Corona Eclipse

APOD

Astronomy Picture of the Day

Discover the cosmos! Each day a different image or photograph of our fascinating universe is featured, along with a brief explanation written by a professional astronomer.

A total eclipse Sun is featured in the image center. Around the Sun is a filamentary gold-hued corona flowing out in all directions.  Please see the explanation for more detailed information.

A Golden Corona Eclipse

Explanation: This total solar eclipse appeared not only poetically beautiful but scientifically interesting. Usually the solar corona appears white, and to some observers the corona of last week’s total solar eclipse did appear this pearly color. But this time, totality observers in Spain saw a corona that appeared unusually golden. For one reason, from Spain, the totality occurred when the setting Sun was near the horizon. That low, sunlight travels through a large amount of air which scatters out blue light. An unusual amount of smoke in the air from nearby forest fires acted as a second filter, further scattering the remaining blue tones and deepening the already gold-dominated light. The HDR-processed, multiple-exposure featured image was captured from Benavente, Spain last week. One thing that did not appear golden was a hydrogen-glowing prominence that hovered over the Sun‘s left edge — its original bright pink color survived.

Gallery: Solar Eclipse of 2026 August 12
Tomorrow’s picture: fast meteors

Date: August 17, 2026
Credit & Copyright: Rui Santos (Living Impressions)
Authors & editors: Robert Nemiroff, Jerry Bonnell, Cecilia Chirenti, Keighley Rockcliffe
A service of: ASD at NASA / GSFC,
NASA Science Activation & Michigan Tech. U.
  •  
❌