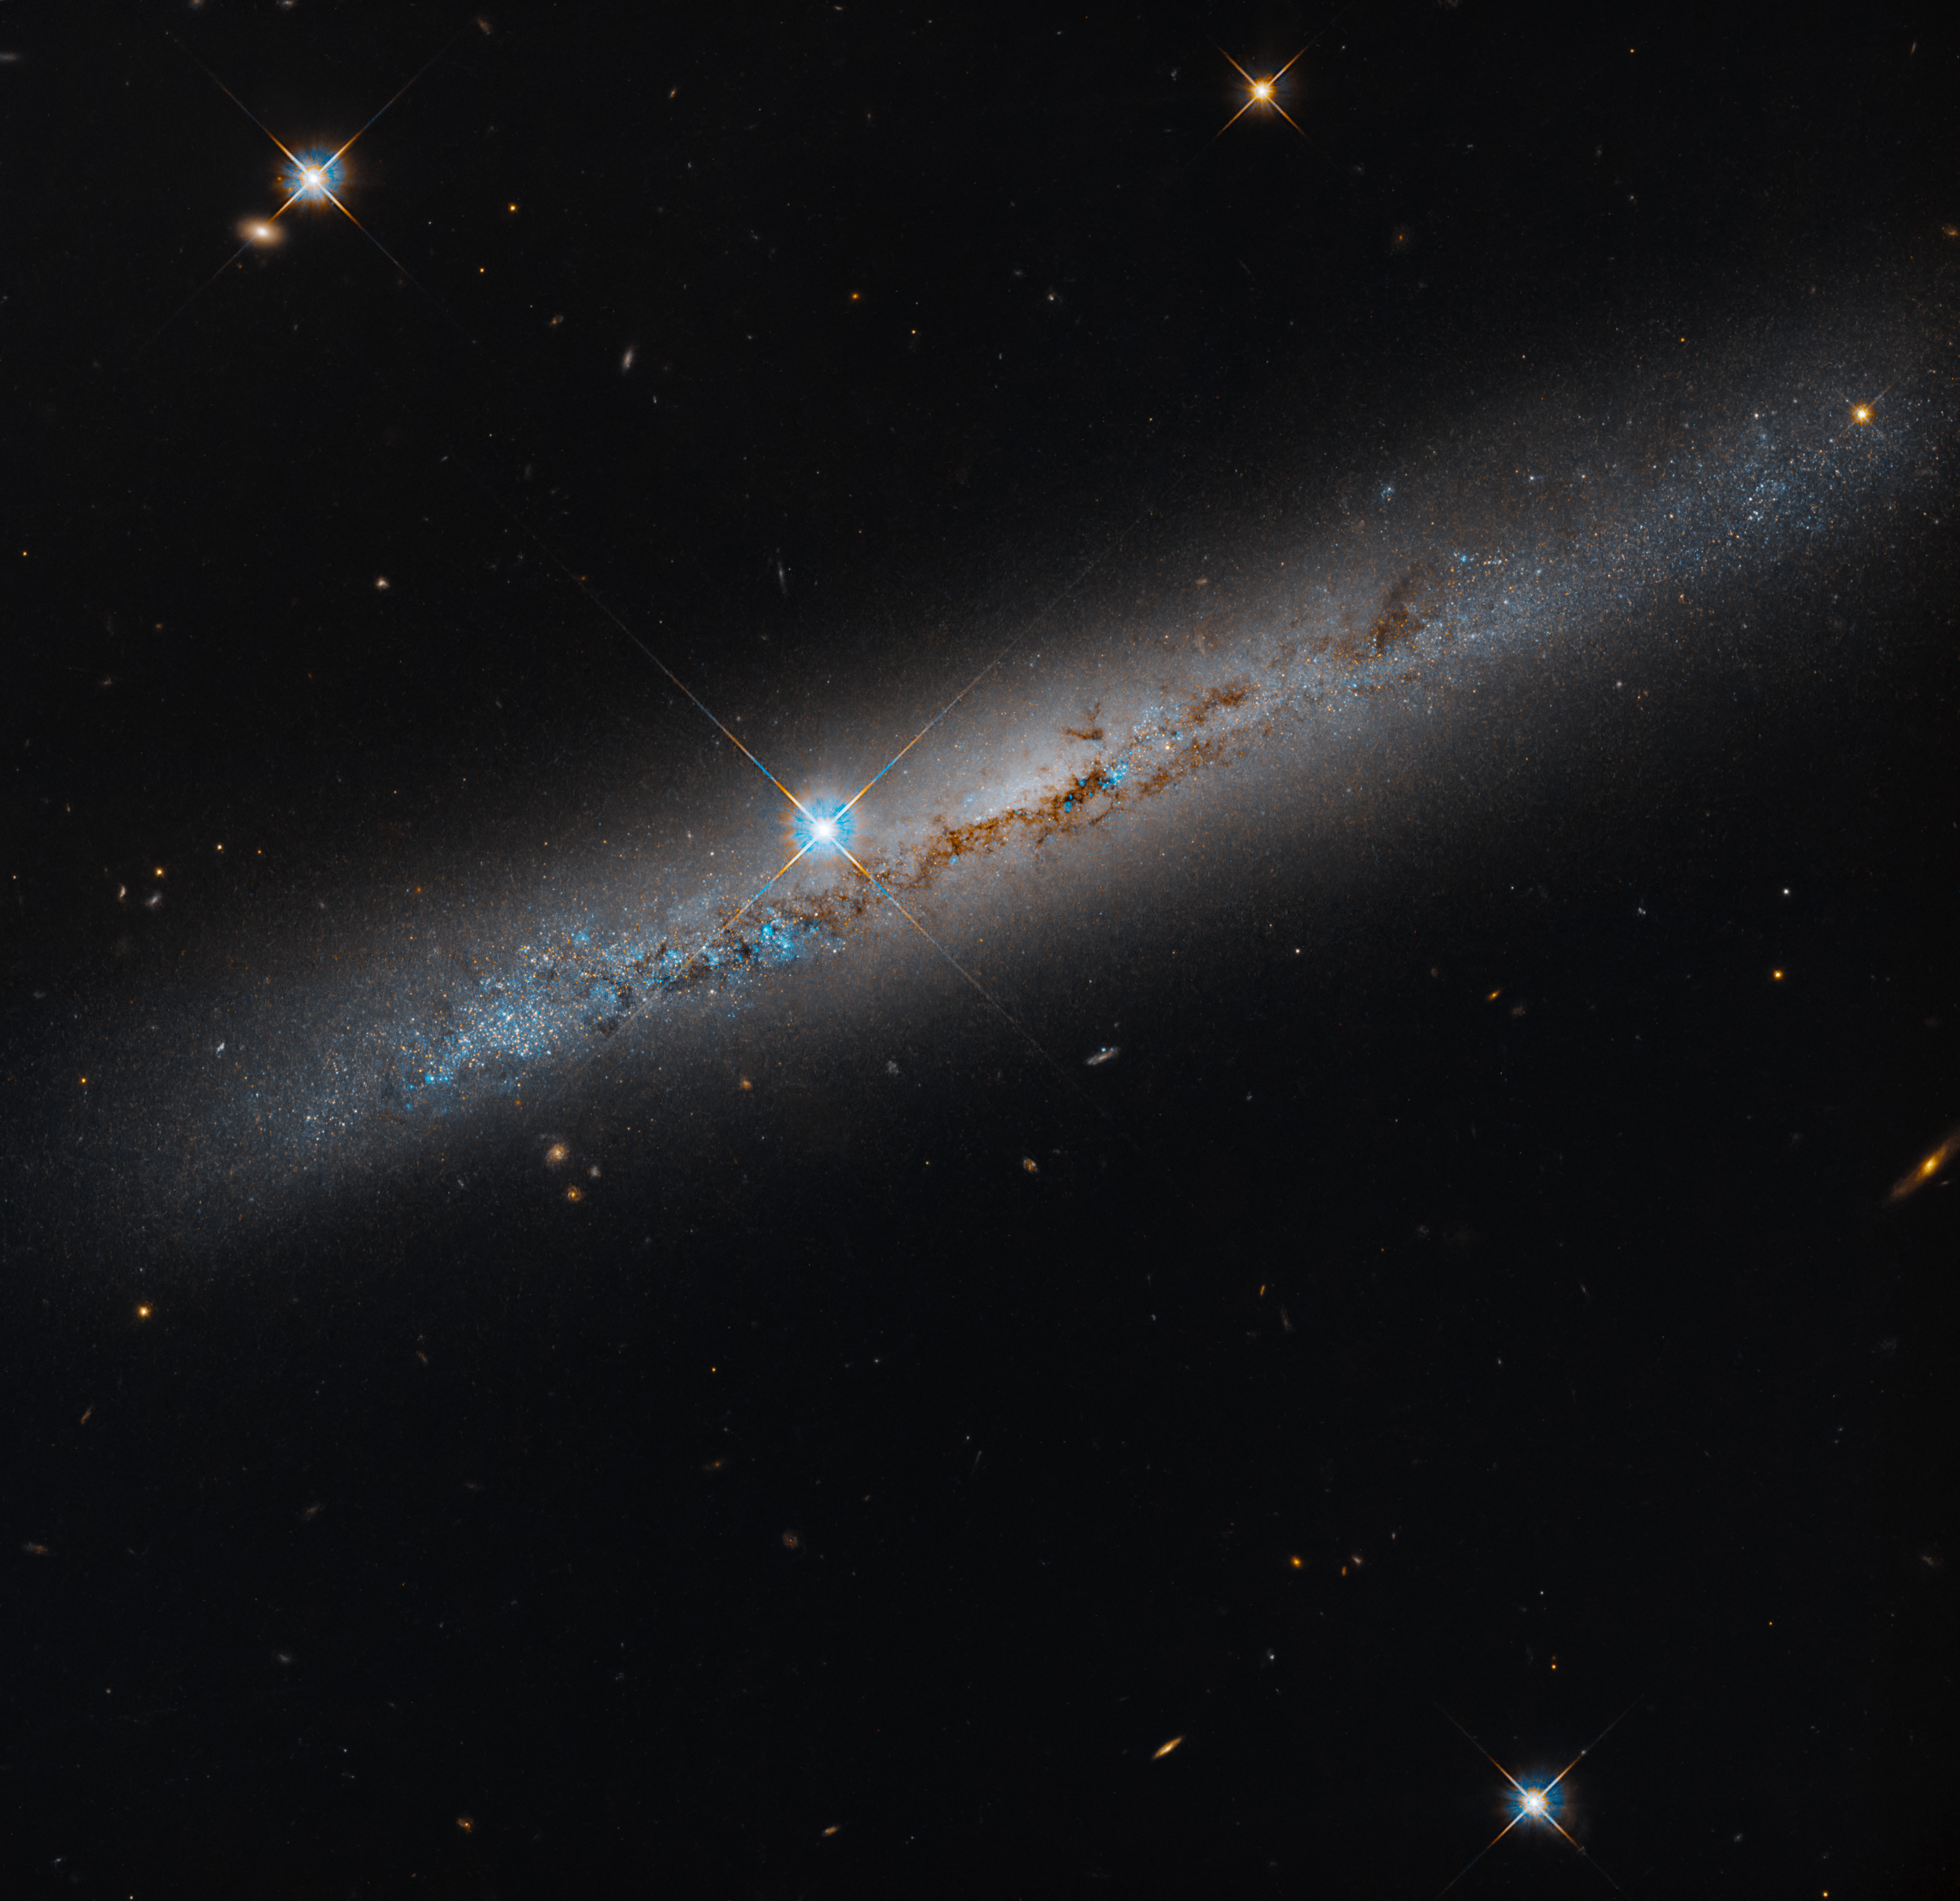
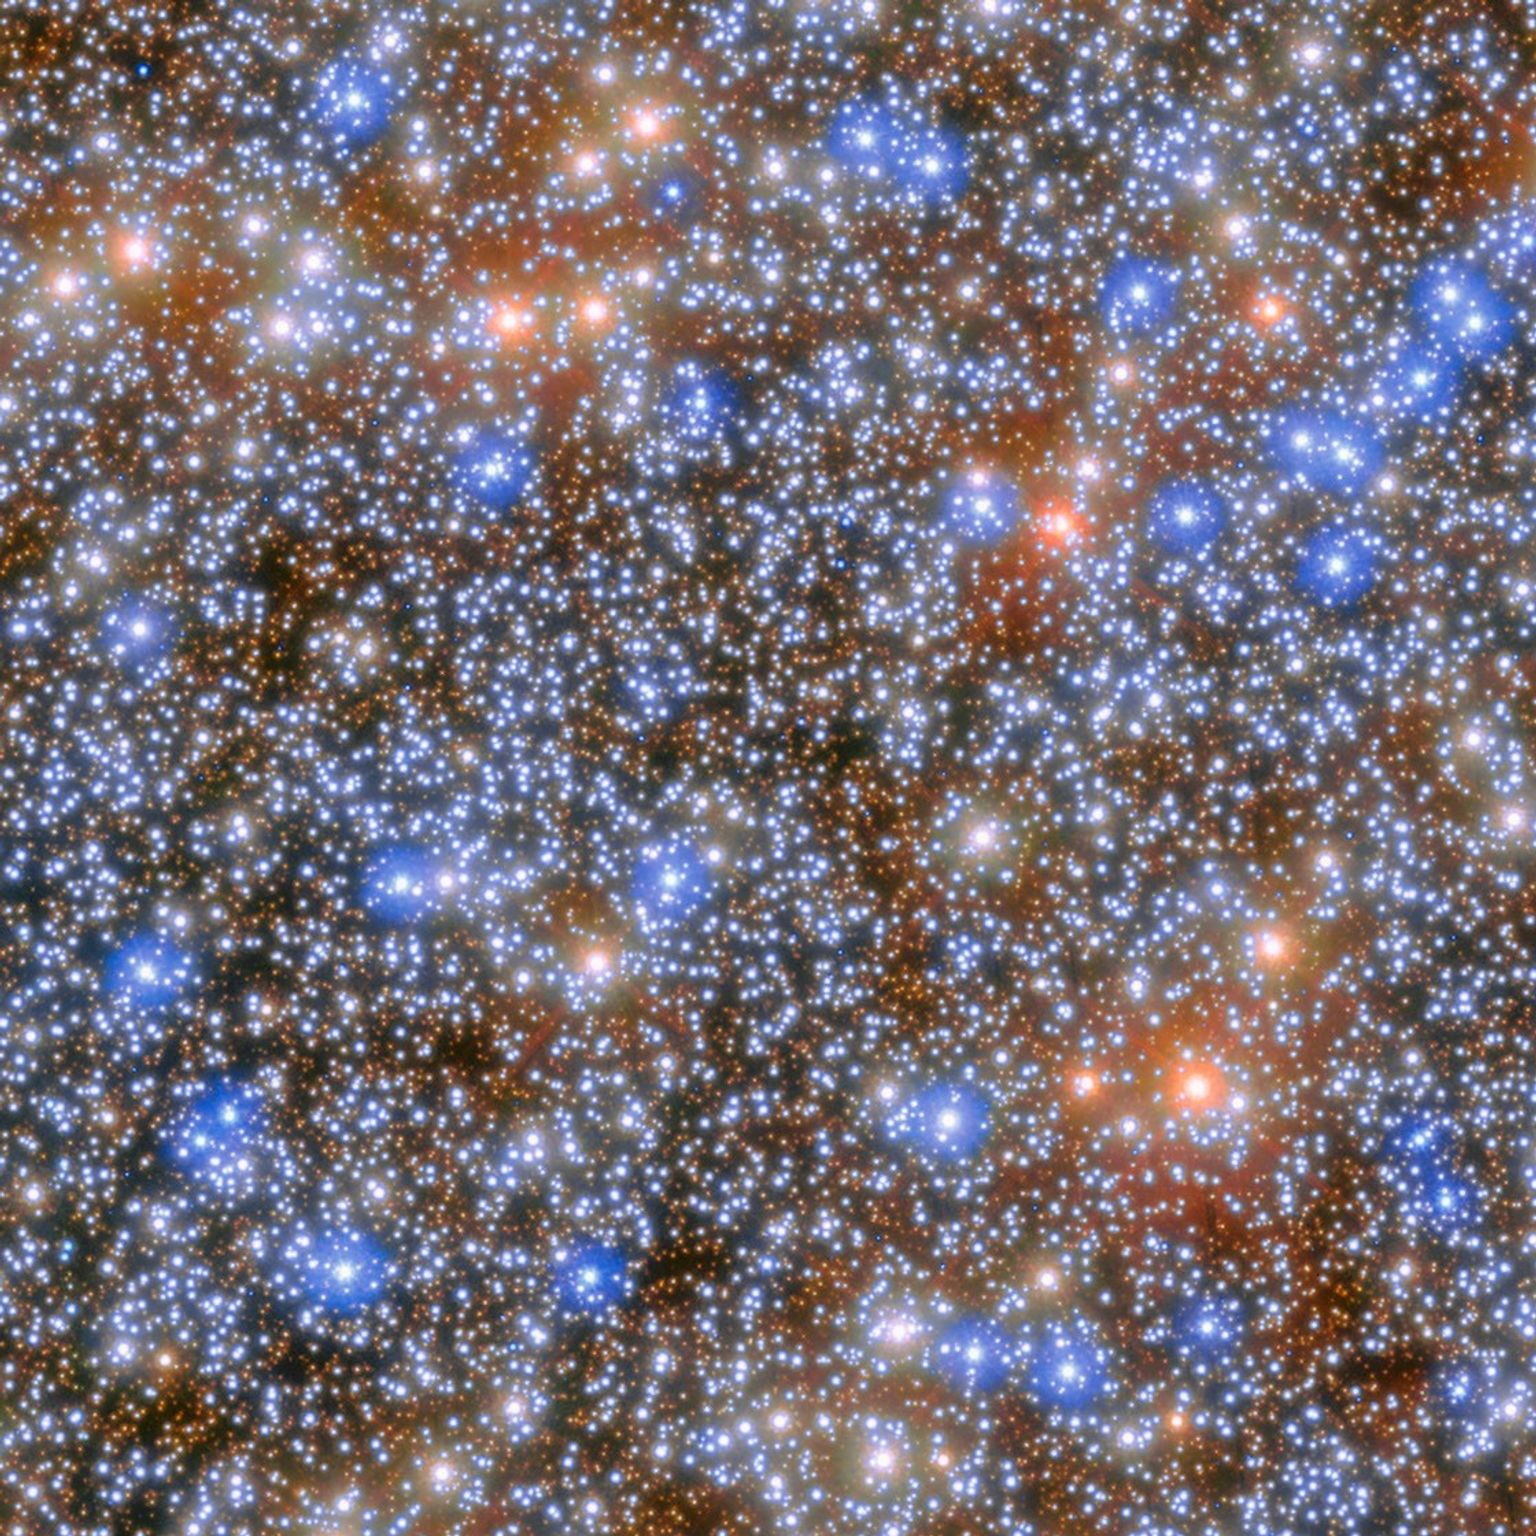
This NASA Hubble Space Telescope image features the edge-on, intermediate spiral galaxy NGC 1827. Its rusty-brown dust lanes bisect the galaxy lengthwise. Look for distant galaxies that dot the black background, while a smattering of foreground stars are easily identified by their diffraction spikes.
NASA, ESA, Michael Jones (California Institute of Technology); Image Processing: Gladys Kober (NASA/Catholic University of America)
This NASA Hubble Space Telescope image features the edge-on, intermediate spiral galaxy NGC 1827, located roughly 37 million light-years away in the constellation Columba, the Dove. Hubble captured the image as part of a survey looking at 260 satellite galaxies around 22 Milky Way-like host galaxies within a radius of about 32 million light-years from Earth. Hubble has already observed 111 of these satellite galaxies. The remaining galaxies will take an additional 149 Hubble orbits, one orbit for each galaxy, to observe.
The image, taken with Hubble’s Advanced Camera for Surveys, reveals bright-blue regions along the galaxy’s disk dotted with dark dust lanes where new stars are likely forming. A bright foreground star appears just to the left of the galaxy’s bright central bulge but is located between us and the galaxy. Its four diffraction spikes are the result of light bending around the internal supports that hold Hubble’s secondary mirror.
Low-mass galaxies like the ones in this Hubble observing program provide a way to test the predictions of cosmological models on small scales, which struggle to match observations. The data Hubble gathers will help us better understand and characterize the properties of low-mass galaxies in Milky Way-like systems, allowing researchers to refine cosmological models.
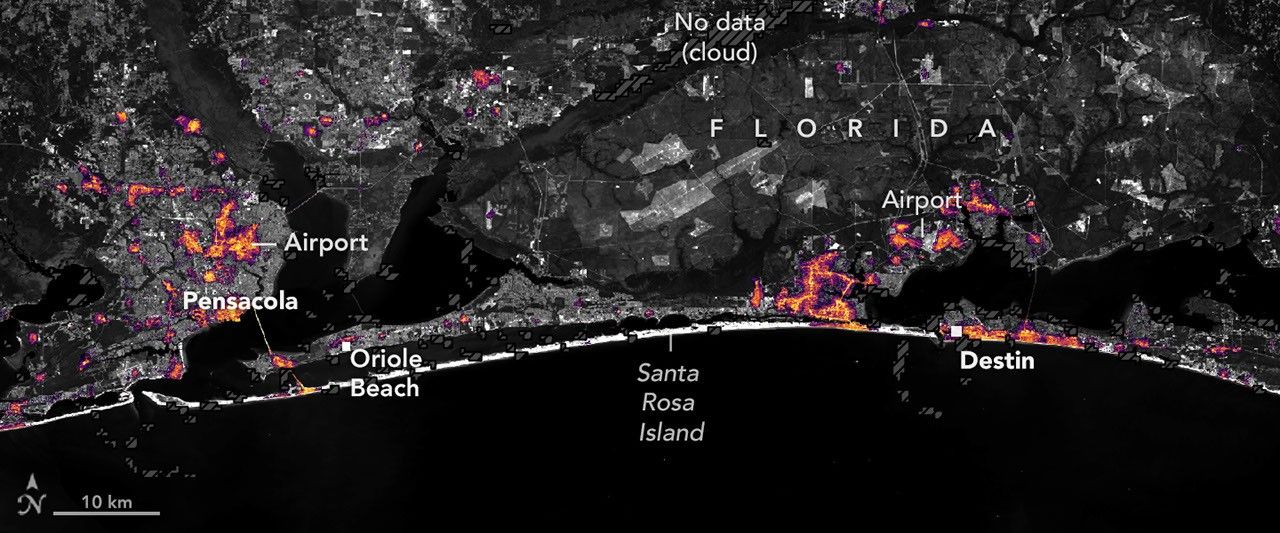
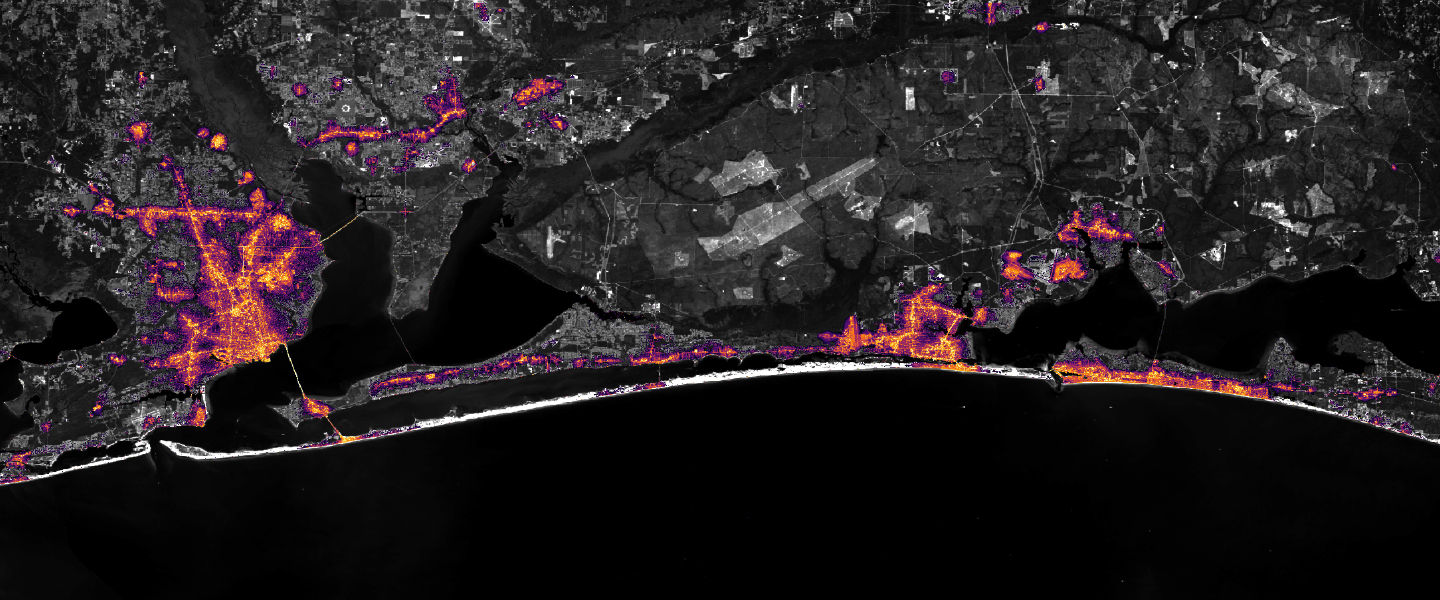
Nighttime lights along the Florida Panhandle coast in August 2026, brightest in Pensacola and Destin and along the road between them.
NASA Earth Observatory / Lauren Dauphin
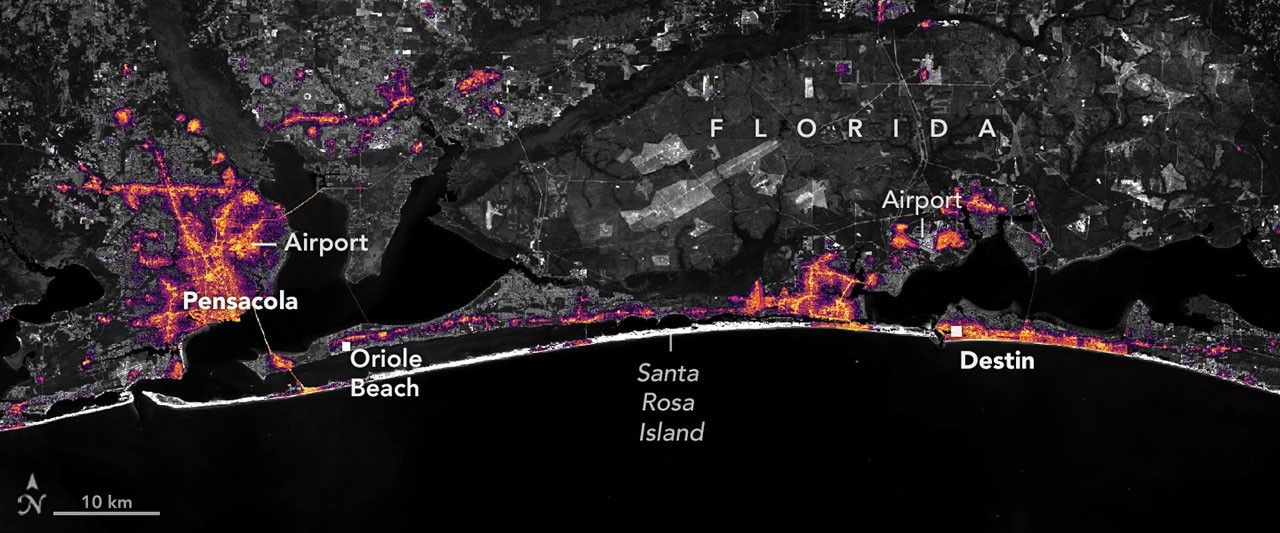
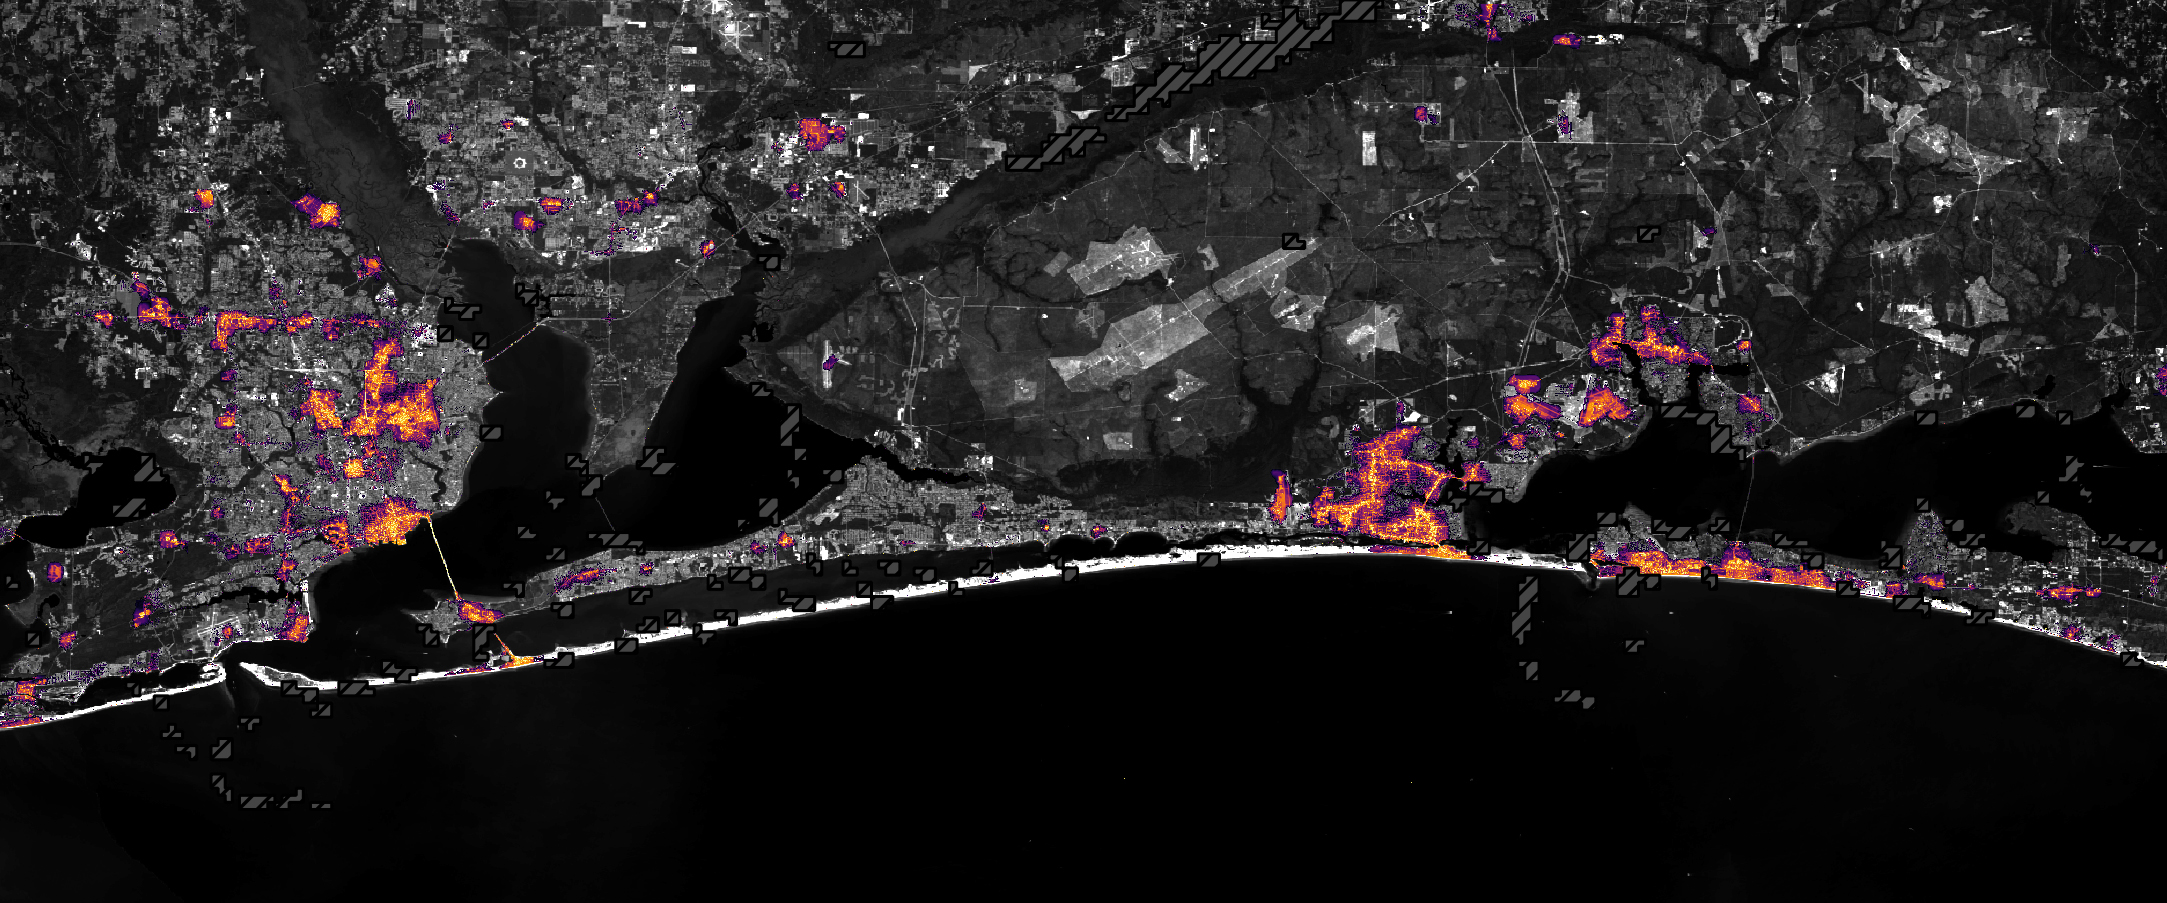
Nighttime lights along the Florida Panhandle coast on October 11, 2026, after Hurricane Isaias, with fewer and dimmer lights in Pensacola and Destin and gaps along the road between them.
NASA Earth Observatory / Lauren Dauphin
Nighttime lights along the Florida Panhandle coast in August 2026, brightest in Pensacola and Destin and along the road between them.
NASA Earth Observatory / Lauren Dauphin
Nighttime lights along the Florida Panhandle coast on October 11, 2026, after Hurricane Isaias, with fewer and dimmer lights in Pensacola and Destin and gaps along the road between them.
NASA Earth Observatory / Lauren Dauphin
August 2026 Composite
October 11, 2026
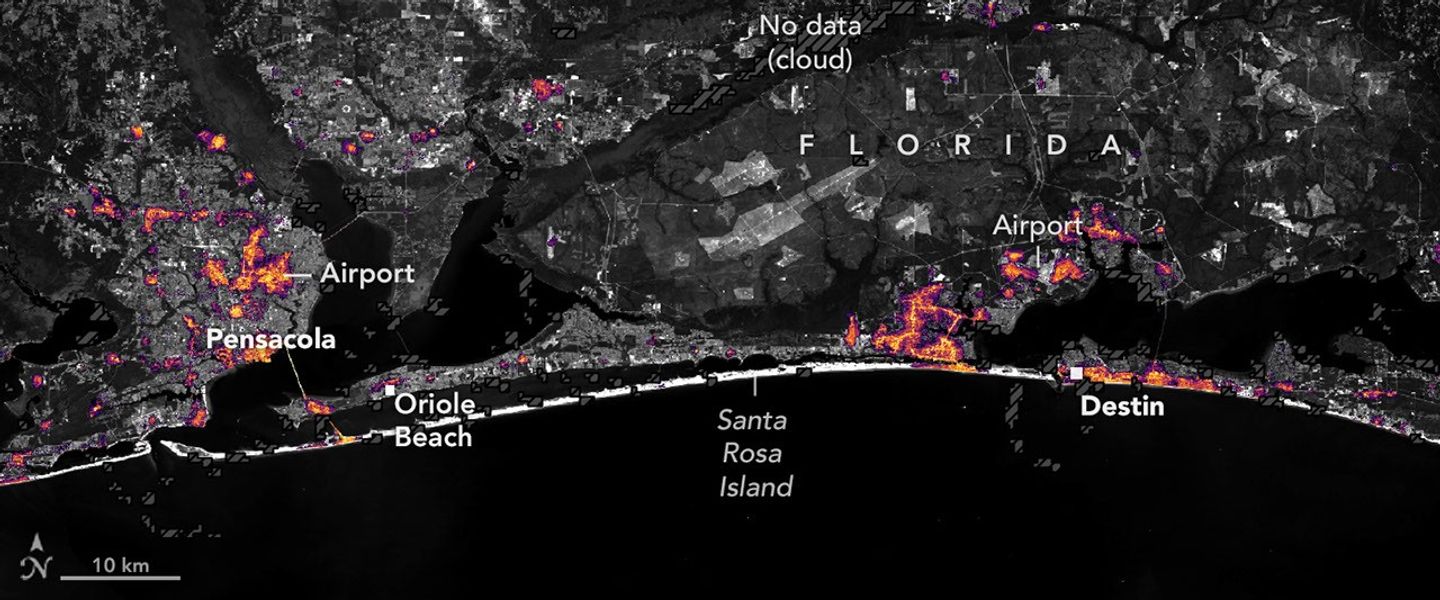
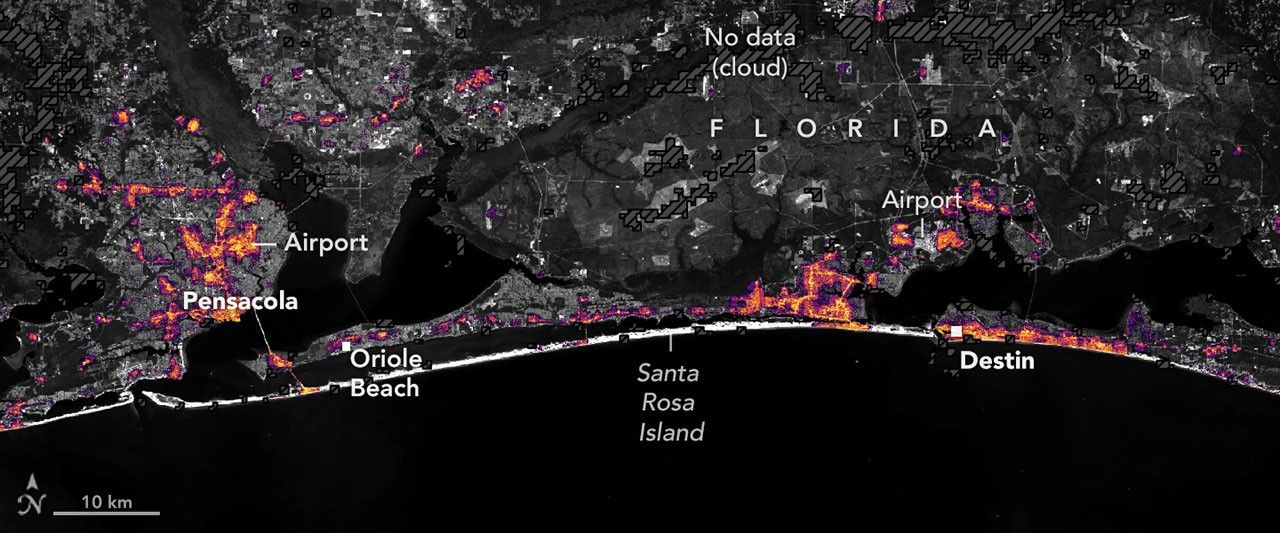
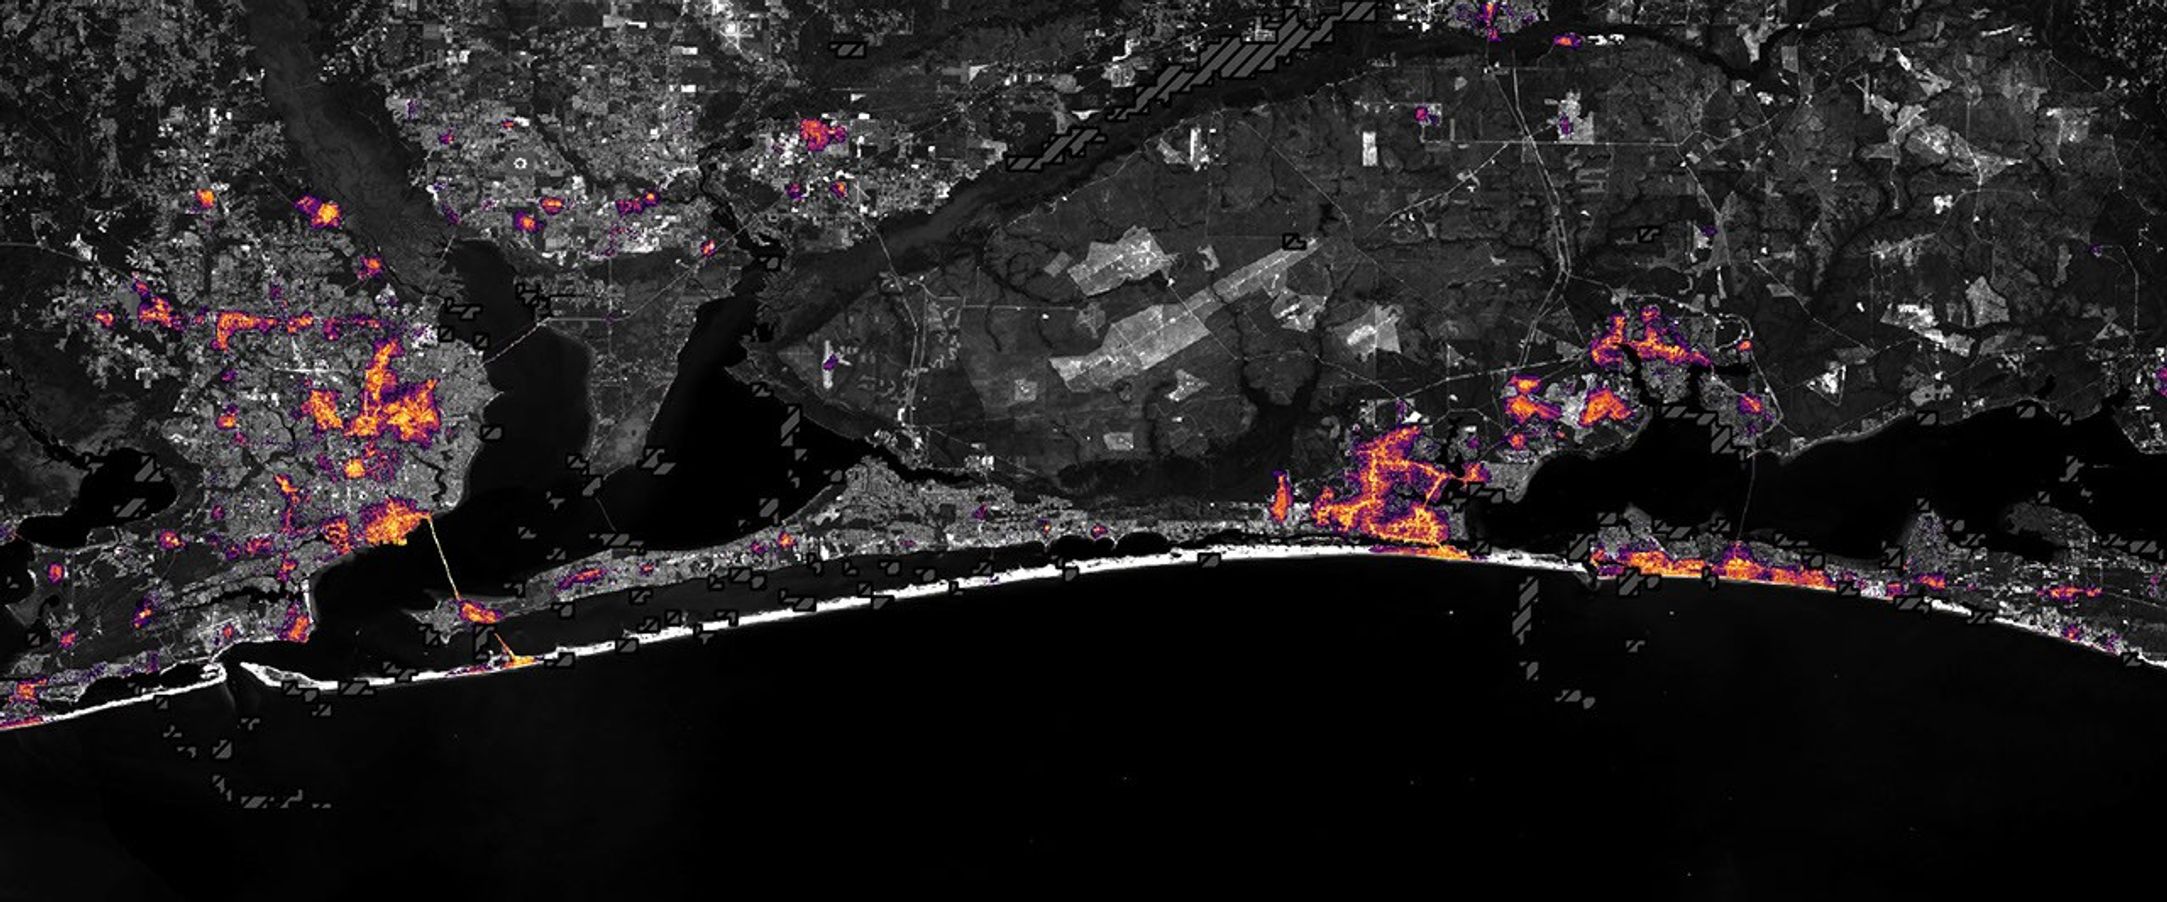
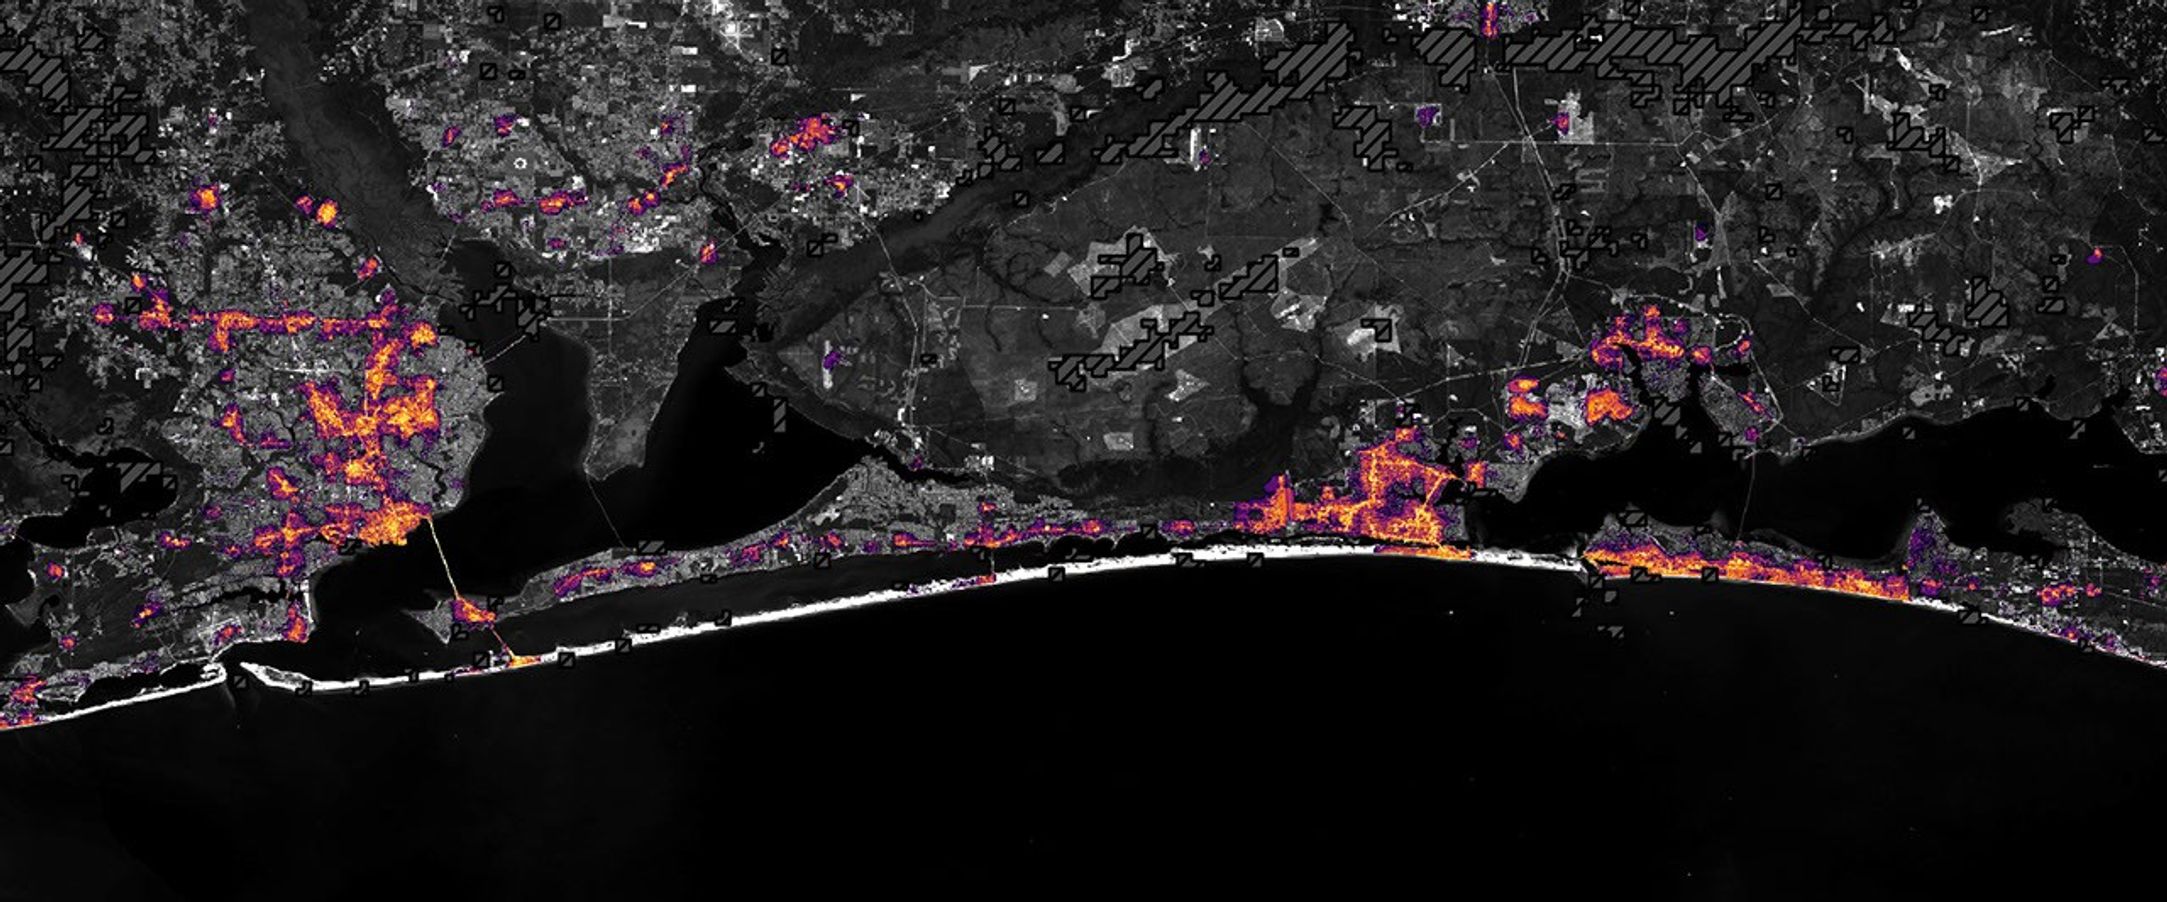
Lights around Pensacola, Florida, and along the U.S. Route 98 corridor toward Destin appear sharply reduced on October 11, 2026 (right), compared with typical conditions in August 2026 (left), suggesting widespread power outages after Hurricane Isaias. Images are from NASA’s Black Marble HD product.
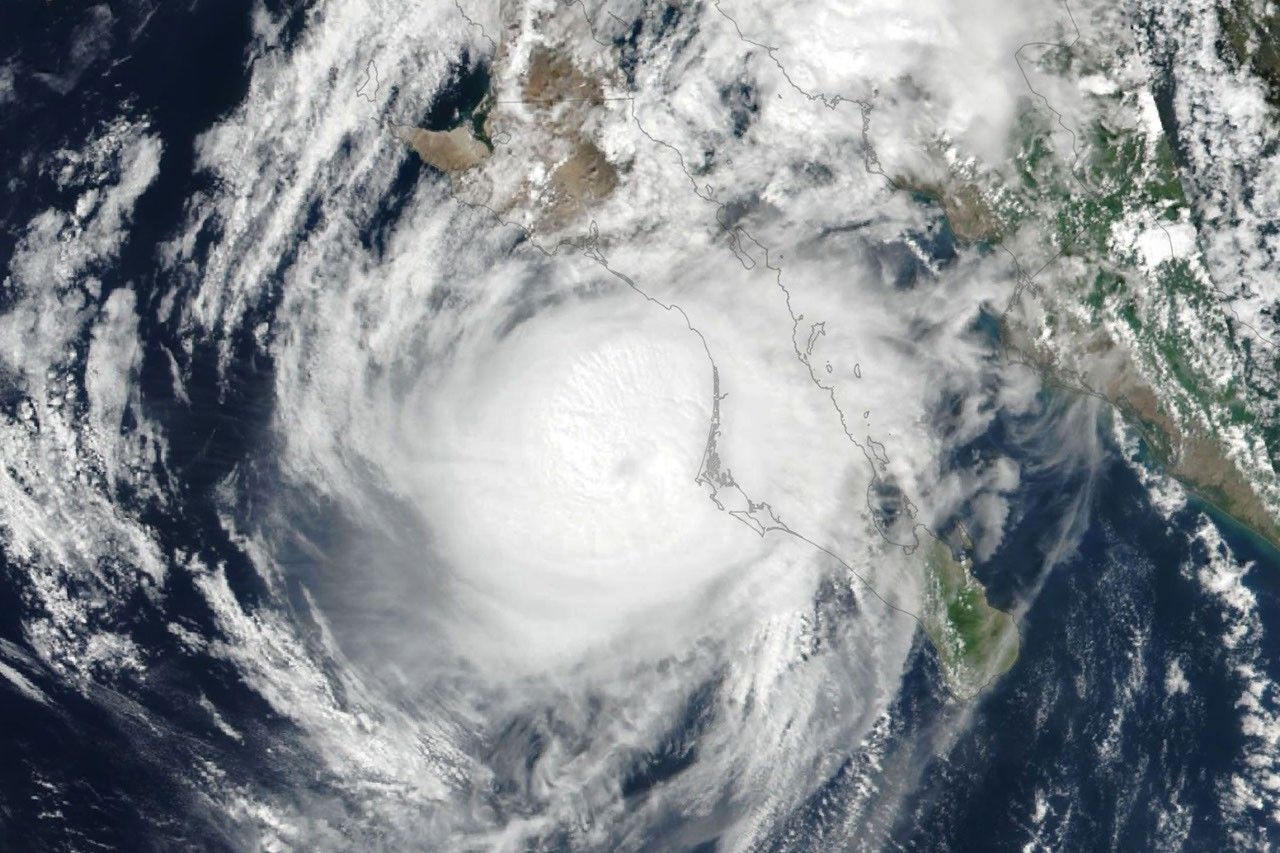
After a quiet start to the 2026 Atlantic hurricane season, Isaias became the season’s first hurricane on October 8 as it tracked toward the U.S. Gulf Coast. The storm brought heavy rain and flash flooding to parts of the Southeast, including Alabama and the Florida Panhandle, and winds that toppled trees and downed power lines, leaving many people in the dark.
Isaias made landfall near Destin, Florida, on the evening of October 9 as a Category 2 hurricane with maximum sustained winds of 105 miles (170 kilometers) per hour. Gusts topped 100 miles per hour along a corridor west of the storm’s center, according to the National Weather Service, with preliminary reports showing a 117-mile-per-hour gust in Oriole Beach and a 102-mile-per-hour gust at Pensacola City Hall.
These areas of high winds overlapped a broader area west of the storm’s eye where satellite images showed substantial decreases in nighttime lights. The image pair above shows nighttime lights before and after the storm. The left image is a composite of August 2026 data representing typical conditions, and the right image shows lights on October 11, after most of the storm’s clouds had cleared.
The data depicted in the images, provided by Ranjay Shrestha of NASA’s Black Marble science team, come from the Black Marble HD product. The product uses data from the VIIRS (Visible Infrared Imaging Radiometer Suite) on the NOAA-20 satellite, which has a day-night band that detects light emitted and reflected at night. The team processed the data to account for changes in the landscape, the atmosphere, and phase of the Moon, and to filter out stray light that does not come from electric lights. Dark gray, hash-marked areas show where clouds prevented VIIRS from collecting data. The nighttime lights are shown over a base map from the Landsat 9 satellite.
“Standard Black Marble nighttime lights imagery, available through NASA Worldview, provides a broad picture of the storm’s immediate impacts,” Shrestha said. “Black Marble HD takes this a step further by allowing us to visualize these changes at a much finer spatial scale.”
At these finer scales, the images reveal lights decreasing sharply around parts of Pensacola, Florida, and along the U.S. Route 98 corridor toward Destin, suggesting widespread power disruptions. Shrestha also pointed out pockets where lights persisted, including Pensacola International Airport, Pensacola Christian College, and parts of downtown Pensacola. “These patterns could reflect backup power systems, differences in electrical infrastructure, or areas that maintained electricity during the storm, although the imagery alone cannot confirm the underlying reasons,” he said.
October 11, 2026
October 12, 2026
Nighttime lights along the Florida Panhandle coast on October 11, 2026, after Hurricane Isaias, with fewer and dimmer lights in Pensacola and Destin and gaps along the road between them.
NASA Earth Observatory / Lauren Dauphin
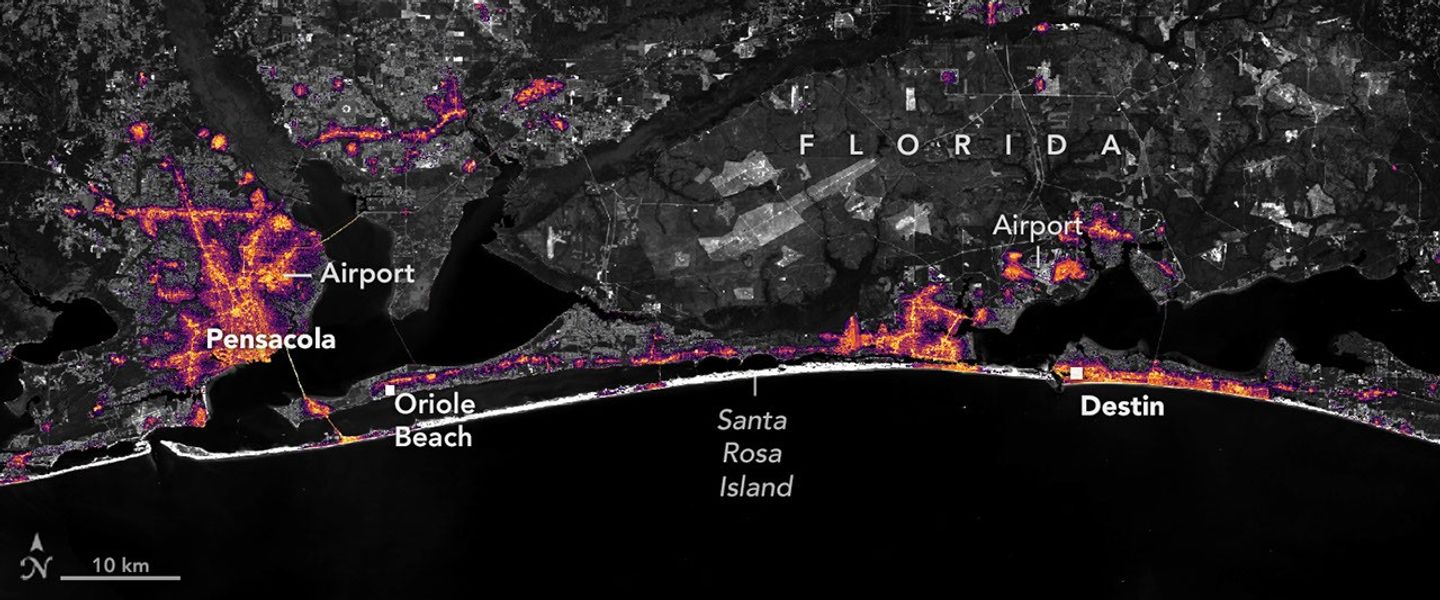
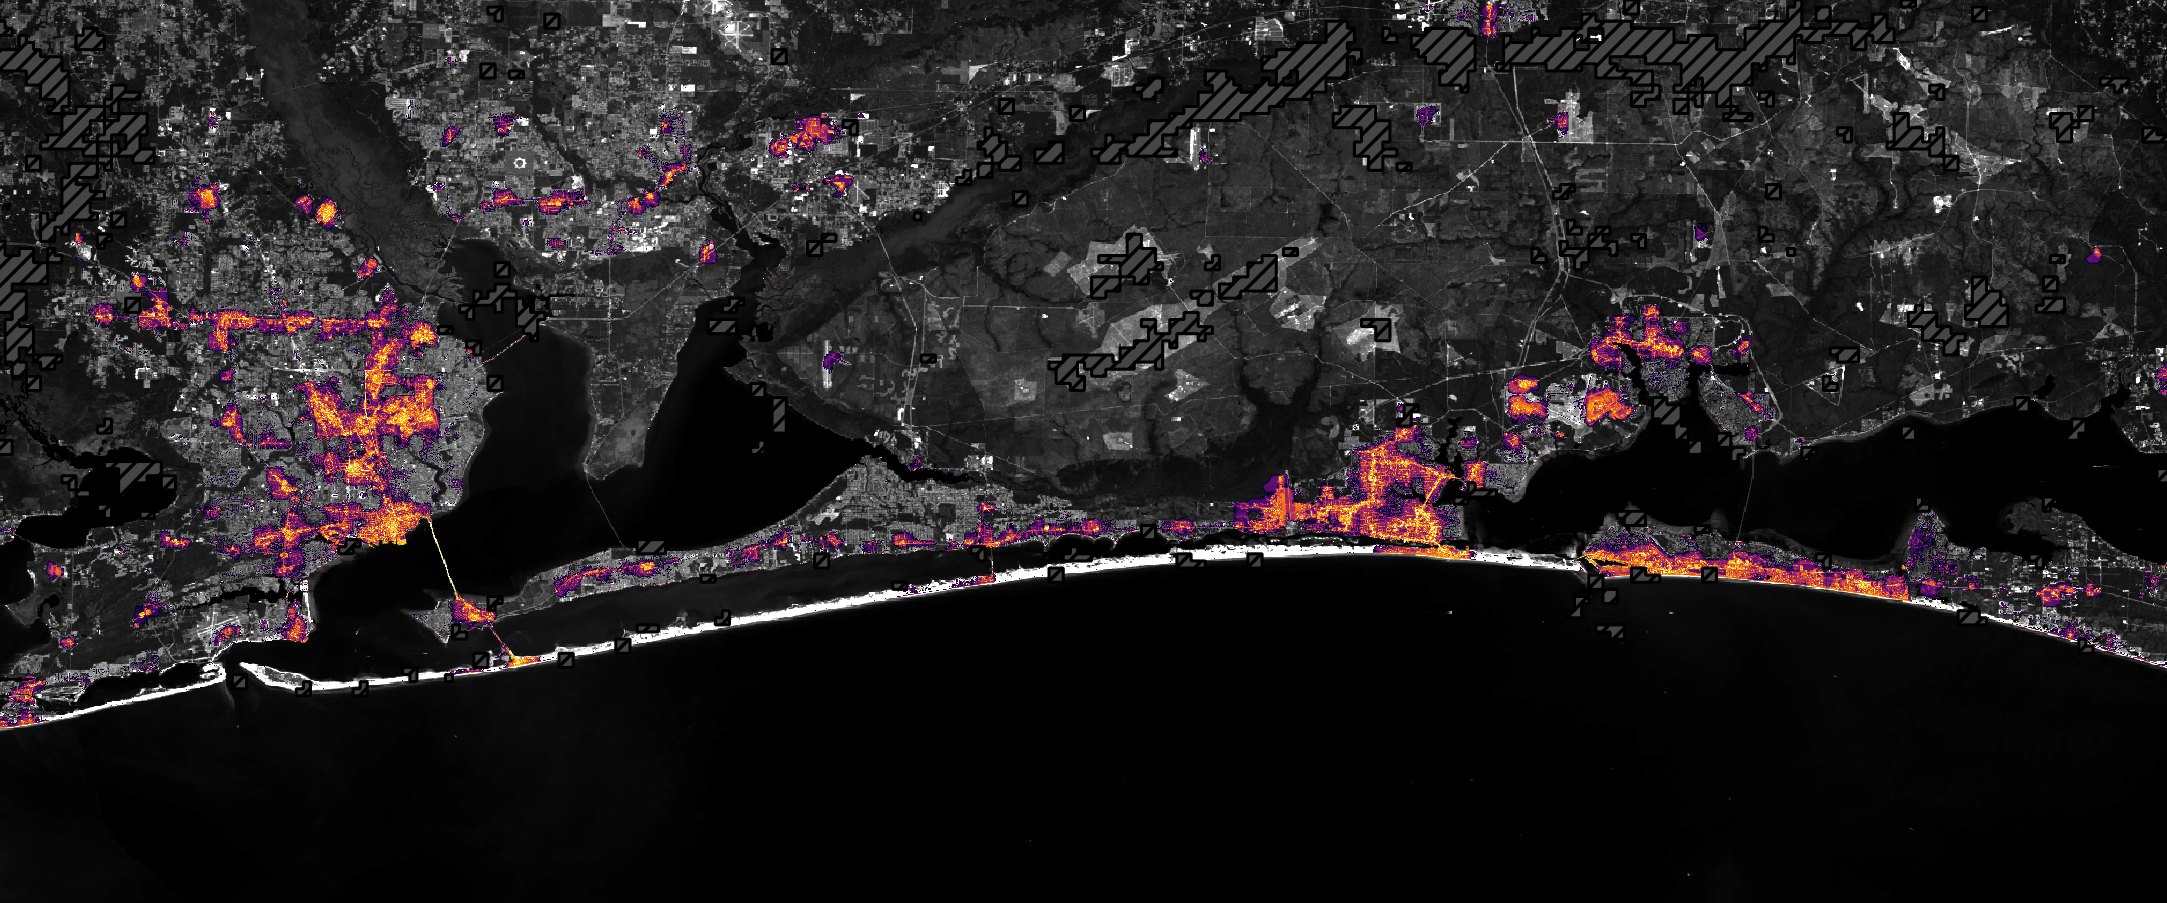
The same area on October 12, 2026, with lights in Pensacola and Destin and along the road between them closer to pre-storm levels.
NASA Earth Observatory / Lauren Dauphin
Nighttime lights along the Florida Panhandle coast on October 11, 2026, after Hurricane Isaias, with fewer and dimmer lights in Pensacola and Destin and gaps along the road between them.
NASA Earth Observatory / Lauren Dauphin
The same area on October 12, 2026, with lights in Pensacola and Destin and along the road between them closer to pre-storm levels.
NASA Earth Observatory / Lauren Dauphin
October 11, 2026
October 12, 2026
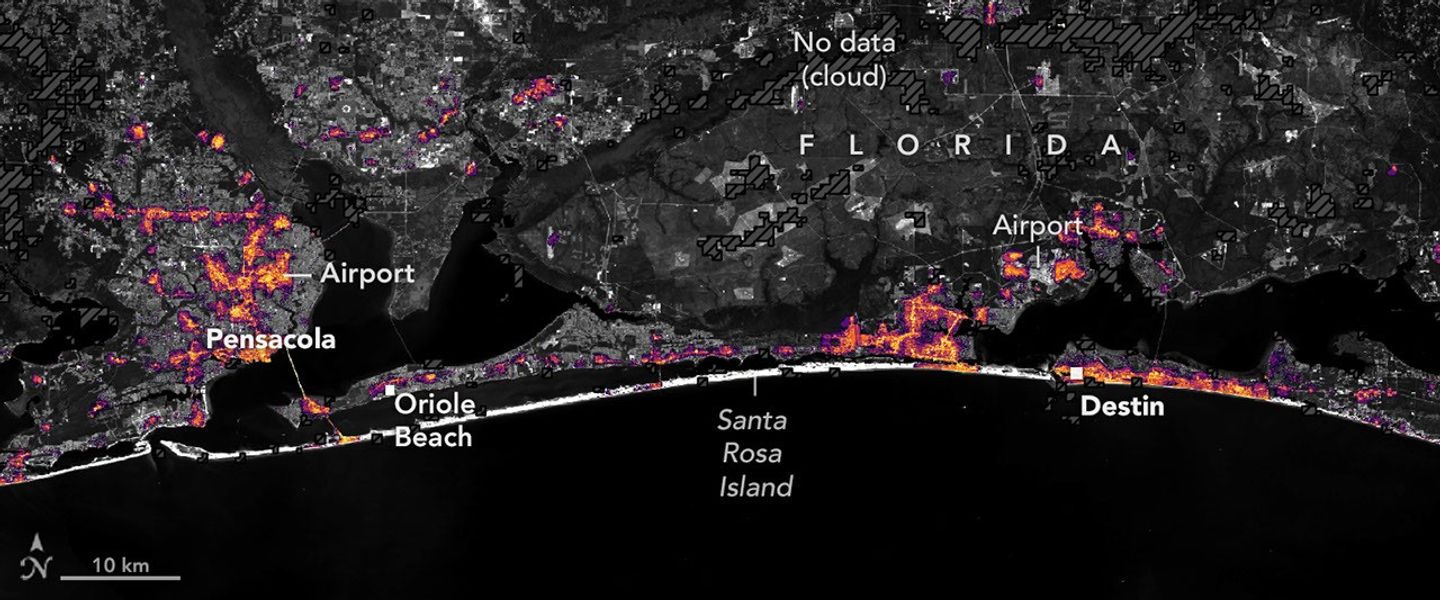
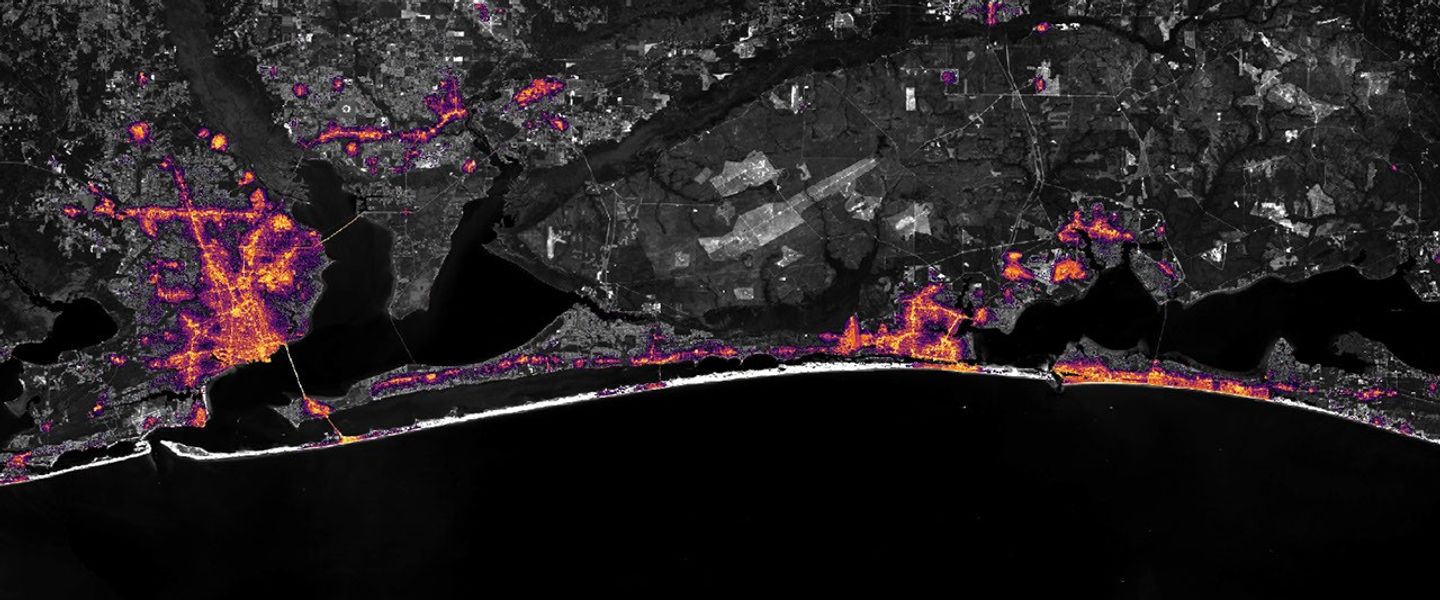
Widespread outages darken the region around Pensacola, Florida, and along the U.S. Route 98 corridor toward Destin on October 11, 2026 (left). By October 12 (right), lights have returned to some affected areas. Images are from NASA’s Black Marble HD product.
Black Marble HD images also reveal the pace and spatial patterns of recovery. The image pair above compares the same October 11 view (left) with one from October 12 (right), when lights had begun to return to some affected areas. By October 14, lighting patterns looked similar to pre-storm conditions.
“Understanding where recovery is progressing and where disruptions persist can help emergency responders and decision makers identify areas that may require additional attention, prioritize resources, and assess the effectiveness of restoration efforts,” Shrestha said.
Black Marble data complement ground-based outage reports rather than replace them, offering a more comprehensive view of disasters’ impacts and recovery. “Ultimately, this is where the value of Black Marble lies: turning nighttime Earth observations into actionable insights that support informed decisions and help bridge the gap between Earth science and action,” Shrestha said.
The NASA Disasters Program, in coordination with FEMA and the USGS Coastal Storms Team, is supporting the Alabama Red Cross and the Alabama Emergency Management Agency’s response to Hurricane Isaias. The team will be posting maps and data products on its open-access mapping portal as new information becomes available.
NASA Earth Observatory images by Lauren Dauphin, using Black Marble HD data courtesy of Ranjay Shrestha/NASA’s Goddard Space Flight Center and Landsat data from the U.S. Geological Survey. Story by Kathryn Hansen.
This visualization compares three ocean data products, sea surface temperature anomaly, apparent visible wavelength, and sea surface height anomaly, over the same months in 2025 and 2026. Signals of El Niño in each map are highlighted with pop-up labels.
Credits: NASA’s Scientific Visualization Studio
A phenomenon rarer than a solar eclipse and more powerful than any single storm system is unfolding this fall, and NASA is tracking it closely.
El Niño is a natural climate pattern that emerges roughly every two to seven years marked by warmer-than-normal water temperatures in parts of the equatorial Pacific. NASA scientists are keeping watch as it flips trade winds, redistributes ocean heat, scrambles rain patterns, and raises sea surface height across parts of the Pacific.
As of October, the National Oceanic and Atmospheric Administration (NOAA) has said that there’s an 83% chance that the strongest El Niño since 1950 is currently unfolding. People around the world, including farmers, firefighters, and coastal communities, are already experiencing the effects in different ways.
Follow along with these maps as NASA tracks El Niño from its epicenter in the equatorial Pacific Ocean.
Sea surface height in flux
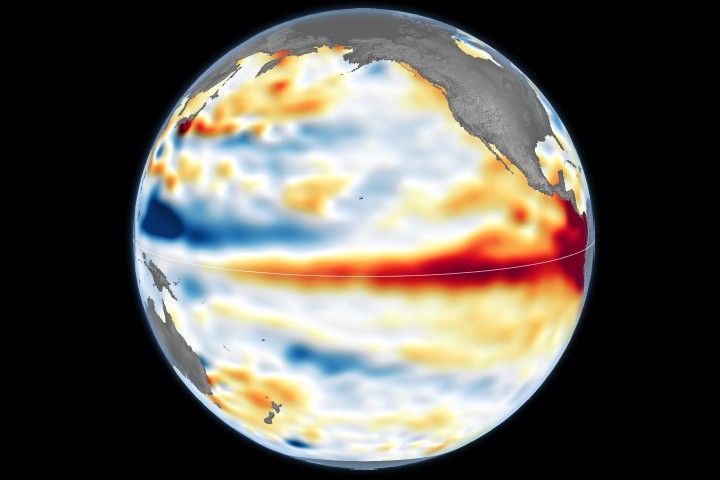
Lower-than-normal sea level conditions appear blue, and higher areas are orange and red in this map, which compares the ocean in 2025 (a weak La Niña year) and 2026. The map was created using altimetry data from the Sentinel-6 satellites, which measure water height for the entire ocean every 10 days, down to fractions of an inch.
Credit: NASA’s Scientific Visualization Studio
One of the first clues appeared in satellite imagery in January 2026, when a swell of warm water called a Kelvin wave was spotted near Micronesia in the western Pacific. Kelvin waves are slow-moving pulses of water thousands of miles long. Like underwater freeways, they transfer heat from west to east across the Pacific. The warm water heats the air directly above it, making it rise. The change in air pressures weakens or even reverses the trade winds that typically blow in the opposing direction, from the Americas toward Asia, causing sea levels in the eastern Pacific to rise further, and waters to warm even more. This chain reaction signifies the start of an El Niño.
The map above shows that by early April, those Kelvin waves had reached the eastern Pacific, and sea surface temperatures had begun to warm. Warm water expands in volume, elevating local sea levels in some areas by as much as 1 to 1.3 feet (30 to 40 centimeters). The higher-than-normal water can be seen sloshing toward South America then moving up the coast to California. Sea levels that are six to eight inches (15 to 20 centimeters) lower than normal are visible around Indonesia and northern Australia.
“Kelvin waves are like the heartbeat of El Niño,” said Josh Willis, project scientist for sea level missions at NASA’s Jet Propulsion Laboratory in Southern California. “And our sea level satellites let us peer into the ocean and watch every beat.”
Scientists have used satellite altimetry to track the height of the ocean with ultraprecision since 1993. That unbroken data record continues today with the Sentinel-6 satellites. State-of-the-art radar altimeters aboard these satellites survey millions of square miles of ocean in a single day, complementing NOAA’s fleet of ocean sensors and buoys drifting and diving through the water below.
Warming Pacific waters
The map above compares sea surface temperatures in 2025 (a weak La Niña year) and 2026. Data are acquired from satellite instruments, buoys, and ship sensors.
Credit: NASA’s Scientific Visualization Studio
Warmer-than-normal seawater is one of the best-known indicators of El Niño. Already, sea surface temperatures in the eastern Pacific are about 3 degrees Fahrenheit (1.7 degrees Celsius) warmer than the long-term average and could jump another fraction of a degree in the coming months, Willis said.
Satellites carrying microwave and infrared radiometers can see through and around clouds to measure heat energy at the sea surface. Satellites in 2026 mapped the band of warmer-than-normal water as it expanded throughout the spring. The band, seen in dark red, stretches for millions of square miles from the heart of the Pacific to the coast of South America. Ocean temperatures can influence weather patterns around the world. Air above the water’s surface carries heat and moisture into the atmosphere, seeding rainstorms and rearranging weather patterns across the globe.
Ocean gets bluer
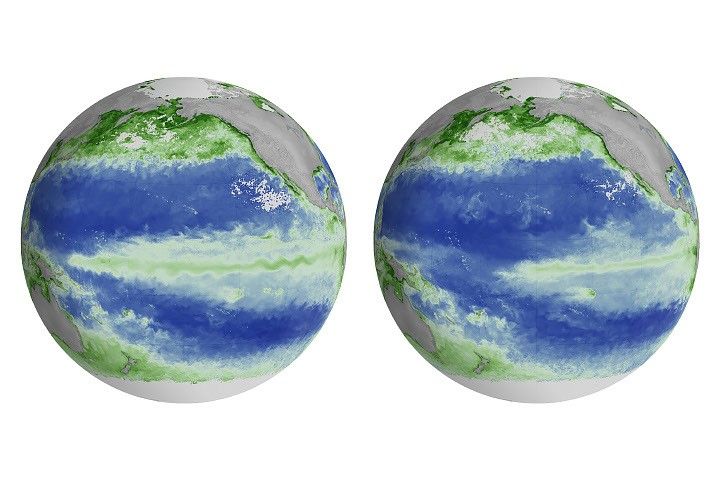
The map above compares Apparent Visible Wavelength from 2025 (a weak La Niña year) and 2026. Apparent Visible Wavelength is a data product from NASA’s PACE satellite utilizing ocean color data from the Ocean Color Instrument.
Credit: NASA’s Scientific Visualization Studio
El Niño’s warm waters also change the color of the ocean. A NASA satellite is tracking these subtle shifts in hues, as equatorial Pacific waters have become measurably more blue over the last several months.
“Some people think of water as being just blue, but it’s amazing the multitude of colors the ocean can be,” said Matthew Kehrli, a lead research scientist for the PACE (Plankton, Aerosol, Cloud, ocean Ecosystem) satellite team at NASA’s Goddard Space Flight Center in Greenbelt, Maryland.
This spectrum is in part thanks to microscopic plants called phytoplankton, which form the basis of the marine food web. There are thousands of different species of phytoplankton, which come in shades like teal, brown, or green. This year, in areas of the Pacific Ocean along the equator that are typically lush with phytoplankton and greener as a result, these hues are waning.
This is an expected effect of El Niño. Phytoplankton thrive in cool, nutrient-rich waters, but during an El Niño, the weakening trade winds reduce the upwelling of nutrient-rich deep water to the ocean surface. With limited food supply, phytoplankton abundance drops. This decline can trigger cascading effects across the marine food web, forcing other marine life to relocate to new feeding grounds.
This year’s El Niño is the first since PACE launched in 2024, providing new views of the phenomenon. The Ocean Color Instrument aboard PACE observes the ocean in hyperspectral color — across several hundred different wavelengths of visible, near-infrared, and ultraviolet light — monitoring phytoplankton and other ocean-color changes in near-real time. With PACE data, researchers calculate the average color of the ocean, simplifying spectra of light into a single number, known as apparent visible wavelength.
The 2026 map above shows the green area along the equator in the western Pacific Ocean shrink as a bluer shade fills in, indicating fewer phytoplankton. In contrast, the map from 2025 shows how the green-hued section stays steady over time.
“You have expectations of what you would think would happen,” Kehrli said. “But to visually see the results with the data products that you’re working with in real time is gratifying.”
NASA scientists will continue to monitor the signs and impacts of this El Niño with its fleet of Earth-observing satellites.
“El Niño touches almost all of us in some way every time it occurs,” Willis said. “While many have seen what it can do, we look to the ocean to understand why.”

 Accedi